Clostridium difficile–Associated Diarrhea: surveillance 2015-2016
 Clostridium difficile–Associated Diarrhea
Surveillance results: 2015-2016
From April 1, 2015, to March 31, 2016, 95 healthcare facilities participated in the Clostridium difficile–associated diarrhea (CDAD) surveillance program, for a combined total of 5,048,411 inpatient days (Table 1). These participating facilities reported 2,977 cases of healthcare-associated CDAD (HA-CDAD). The incidence rate of HA-CDAD was 5.9 cases per 10,000 patient days. The 2015-2016 incidence rate was significantly lower than the 2014–2015 rate. The 10-day fatality rate was 8.0% (n = 219) while the 30-day fatality rate was 14.0% (n = 381). In total, 23 (0.8%) colectomies were reported. This year, two teaching facilities merged. For all results, only facilities that participated in at least 11 periods are included in the analysis. Data was extracted on May 31st, 2016. This year, new healthcare facility categories have been defined taking into account the teaching vocation, the number of beds and the proportion of admitted patients aged 65 years or older of participating facilities. These new categories have been applied to the current surveillance period as well as to the previous years of surveillance to ensure proper comparisons
Updated : March 1, 2017
Version française
Table 1 – Participation of Healthcare Facilities in the Surveillance of CDAD, Québec, 2011-2012 to 2015–2016
|
|
2011-2012 |
2012-2013 |
2013-2014 |
2014-2015 |
2015-2016 |
|---|---|---|---|---|---|
| Participating facilities (N) |
96 |
96 |
96 |
96 |
95 |
| Admissions (N) |
631,291 |
640,856 |
651,416 |
655,919 |
661,689 |
| Inpatient days (N) |
5,196,485 |
5,240,187 |
5,136,300 |
5,091,013 |
5,048,411 |
| Healthcare-associated CDAD cases (cat. 1a and 1b) (N) |
3,778 |
3,794 |
3,690 |
3,456 |
2,977 |
Incidence Rates
In 2015–2016, the provincial incidence rate for HA-CDAD (cat. 1a and 1b) for all participating facilities was 5.9 cases per 10,000 patient days (Table 2). Some healthcare facilities characteristics are associated with higher incidence rate. Incidence rate were significantly higher in non-teaching facilities with 110 beds and more, and when the proportion of admitted patients aged 65 years or older is equal or greater to 45%. The incidence rate is greater among teaching facilities with 400 beds and more (Figure 1 and Table 2).
Figure 1 – Healthcare-associated CDAD (cat. 1a and 1b) Incidence Rate, by Healthcare Facility Category, Québec, 2015–2016 (Incidence Rate per 10,000 Patient Days [95% CI])
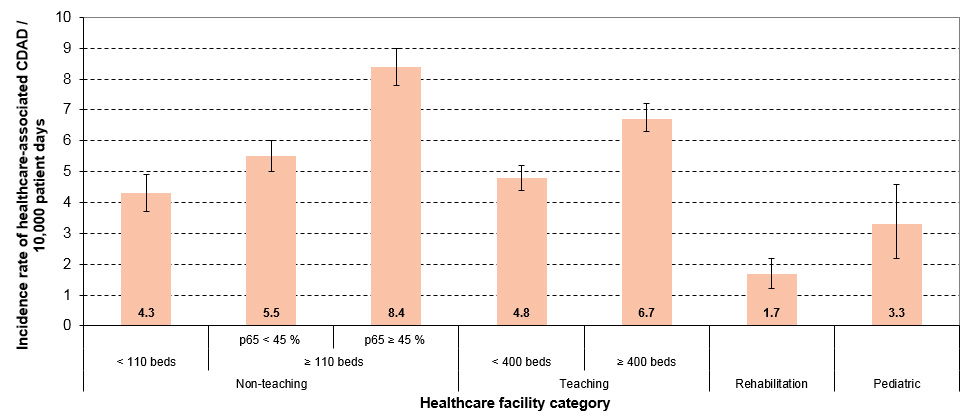
p65: Proportion of admitted patients aged 65 years or older.
95% CI: 95% confidence interval.
In 2015–2016, the types of healthcare facility (Table 2) that reported a CDAD incidence rate higher than that of the reference facilities (facilities ˂ 110 beds) were:
- Non-teaching facilities ≥ 110 beds and p65 < 45% (univariate rate ratio = 1.3);
- Non-teaching facilities ≥ 110 beds and p65 ≥ 45% (univariate rate ratio = 2.0);
- Teaching facilities ˂ 400 beds (univariate rate ratio = 1.1);
- Teaching facilities ≥ 400 beds (univariate rate ratio = 1.6).
Table 2 – Percentile, Incidence Rate and Univariate Rate Ratio of Healthcare-Associated CDAD (cat. 1a and 1b) by Healthcare Facility Category, Québec, 2015–2016 (Incidence Rate per 10,000 Patient Days [95% CI])
|
Healthcare Facility Category |
Distribution Indicator |
Incidence Rate |
Univariate Rate Ratio |
|||||
|---|---|---|---|---|---|---|---|---|
|
[I.C. 95 %] |
[I.C. 95 %] |
|||||||
|
Min. |
25 % |
50 % |
75 % |
90 % |
Max. |
|||
| Non-teaching < 110 beds (N = 32) |
0.8 |
1.8 |
3.8 |
5.3 |
8.3 |
11.8 |
4.3 [3.7 ; 4.9] |
(réf) |
| Non-teaching ≥ 110 beds and p65 < 45% (N = 13) |
1.0 |
4.0 |
5.0 |
7.0 |
9.4 |
10.5 |
5.5 [5.0 ; 6.0] |
1.3 [1.1 ; 1.5]¥ |
| Non- teaching ≥ 110 beds and p65 ≥ 45% (N = 18) |
2.8 |
4.3 |
6.2 |
11.9 |
15.2 |
15.4 |
8.4 [7.8 ; 9.0] |
2.0 [1.7 ; 2.3]¥ |
| Teaching < 400 beds (N = 14) |
2.2 |
3.5 |
4.7 |
6.3 |
6.8 |
9.2 |
4.8 [4.4 ; 5.2] |
1.1 [1.0 ; 1.3] |
| Teaching ≥ 100 beds (N = 10) |
5.1 |
5.3 |
7.2 |
7.4 |
7.9 |
8.1 |
6.7 [6.3 ; 7.2] |
1.6 [1.3 ; 1.8]¥ |
| Rehabilitation (N = 6) |
0 |
0.4 |
1.9 |
2.8 |
2.8 |
2.8 |
1.7 [1.2 ; 2.2] |
0.4 [0.3 ; 0.6]¥ |
| Pediatric (N = 2) |
2.6 |
2.6 |
3.9 |
5.1 |
5.1 |
5.1 |
3.3 [2.2 ; 4.6] |
0.8 [0.5 ; 1.1] |
|
Total (N = 95) |
0 |
3.1 |
4.9 |
6.8 |
9.4 |
15.4 |
5.9 [5.7 ; 6.1] |
|
¥ Significant statistical difference (p < 0.05) between univariate rate ratio of the healthcare facility category and reference (ref).
p65: Proportion of admitted patients aged 65 years or older.
The univariate analysis presented on Table 3 reveals that:
- Facilities with 110 to 399 beds have a higher annual incidence rate of CDAD than facilities < 110 beds (univariate rate ratio of 1.5);
- Facilities ≥ 400 beds have a higher annual incidence rate of CDAD than facilities < 110 beds (univariate rate ratio of 1.6);
- Facilities with a p65 ≥ 45% have a higher incidence rate than facilities with a p65 < 45% (univariate rate ratio of 1.2);
- Teaching facilities have a lower incidence rate than non-teaching facilities (univariate rate ratio of 0.9);
- Rehabilitation facilities have a lower incidence rate than non-teaching facilities (univariate rate ratio of 0.3);
- Pediatric facilities have a lower incidence rate than non-teaching facilities (univariate rate ratio of 0.5).
Table 3 – Healthcare-associated CDAD (cat. 1a and 1b) Incidence Rate and Univariate Rate Ratio Stratified by Number of Beds, Proportion of Admitted Patients Aged 65 Years or Older and Type of Healthcare Facility, Québec, 2015–2016 (Incidence Rate per 10,000 Patient Days [95% CI])
|
Facility Characteristics |
Incidence Rate |
Univariate Rate Ratio |
|---|---|---|
|
[I.C. 95%] |
[I.C. 95%] |
|
| Number of Beds* | ||
| < 110 beds (N = 34) |
4.2 [3.7 ; 4.8] |
(ref) |
| 110–399 beds (N = 42) |
6.2 [5.9 ; 6.5] |
1.5 [1.3 ; 1.7]¥ |
| ≥ 400 beds (N = 13) |
6.7 [6.3 ; 7.1] |
1.6 [1.4 ; 1.8]¥ |
| Proportion of Admitted Patients Aged 65 Years or Older** | ||
| p65 < 45% (N = 29) |
5.5 [5.1 ; 5.8] |
(ref) |
| p65 ≥ 45% (N = 58) |
6.6 [6.3 ; 6.9] |
1.2 [1.1 ; 1.3]¥ |
| Type of Healthcare Facility | ||
| Non-teaching (N = 63) |
6.5 [6.2 ; 6.8] |
(ref) |
| Teaching (N = 24) |
5.9 [5.6 ; 6.2] |
0.9 [0.8 ; 1.0]¥ |
| Rehabilitation (N = 6) |
1.7 [1.3 ; 2.3] |
0.3 [0.2 ; 0.4]¥ |
| Pediatric (N = 2) |
3.3 [2.3 ; 4.6] |
0.5 [0.4 ; 0.7]¥ |
* The six rehabilitation facilities are excluded from the analysis.
** The six rehabilitation facilities and two pediatric facilities are excluded from the analysis.
¥ Significant statistical difference (p < 0.05) between univariate rate ratio of the healthcare facility category and reference (ref).
p65: Proportion of admitted patients aged 65 years or older.
Incidence Rate Trends
Figure 2 – Healthcare-associated CDAD (cat. 1a and 1b) Incidence Rate for Participating Healthcare Facilities, Québec, 2004–2005 to 2015–2016 (Incidence Rate per 10,000 Patient Days [95% CI]) (N = 95)1
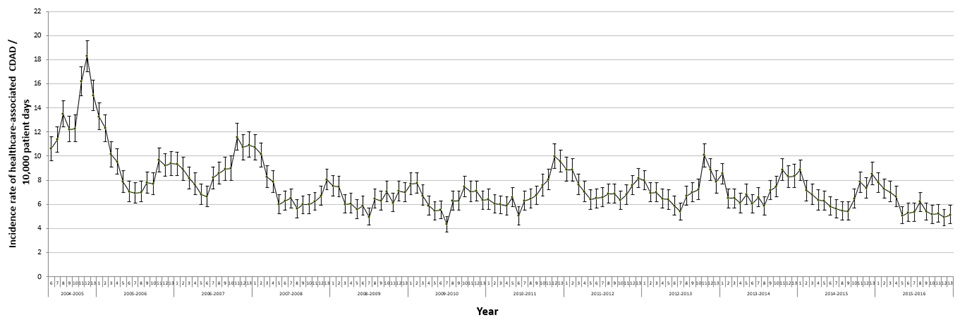
1 Data are those from facilities that participated in surveillance for at least 8 periods in 2004–2005 and at least 11 periods for each year between 2005–2006 and 2015–2016.
Figure 3 – Healthcare-associated CDAD (cat. 1a and 1b) Incidence Rate and Upper Threshold Value (75th percentile) for Participating Facilities, Québec, 2011–2012 to 2015–2016 (Incidence Rate per 10,000 Patient Days [95% CI]) (N = 95)1
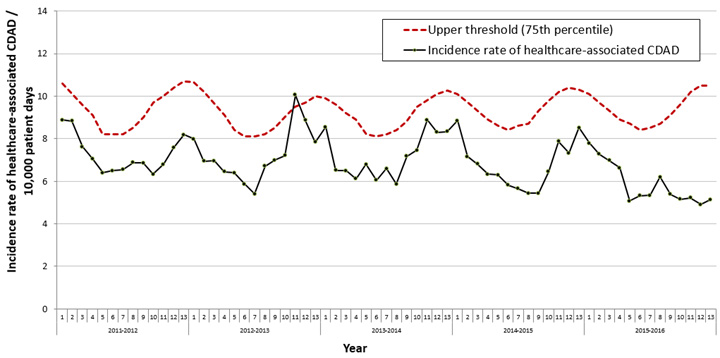
1 Data are those from facilities that participated in surveillance for at least 11 periods for each year between 2011-2012 and 2015-2016.
Compared to 2014-2015, the incidence rate in non-teaching healthcare facilities remained stable in 2015-2016. By contrast, the HA-CDAD incidence among teaching facilities decreased significantly for a second consecutive year, from 5.8 to 4.8 per 10 000 patient days for those having less than 400 beds, and from 8.9 to 6.7 healthcare-associated CDAD per 10 000 patient days for those having 400 beds and more (Table 4).
Table 4 – Healthcare-associated CDAD (cat. 1a and 1b) Incidence Rate by Healthcare Facility Category (N = 95)1, Québec, 2015–2016 (Incidence Rate per 10,000 Patient Days [95% CI])
|
Healthcare Facility Category |
2011-2012 |
2012-2013 |
2013-2014 |
2014-2015 |
2015-2016 |
|---|---|---|---|---|---|
| Non-teaching ˂ 110 beds (N = 32) |
5.0 [4.4 ; 5.6] |
4.7 [4.1 ; 5.3] |
5.0 [4.4 ; 5.7] |
4.3 [3.7 ; 4.9] |
4.3 [3.7 ; 4.9] |
| Non-teaching ≥ 110 beds, p65 ˂ 45% (N = 13) |
5.7 [5.2 ; 6.2] |
5.6 [5.1 ; 6.1] |
6.0 [5.5 ; 6.5] |
5.3 [4.8 ; 5.8] |
5.5 [5.0 ; 6.0] |
| Non-teaching ≥ 110 beds, p65 ≥ 45% (N = 18) |
7.3 [6.8 ; 7.8] |
6.2 [5.7 ; 6.7] |
7.9 [7.4 ; 8.5] |
8.8 [8.2 ; 9.4] |
8.4 [7.8 ; 9.0] |
| Teaching ˂ 400 beds (N = 14) |
7.4 [6.9 ; 7.9] |
7.3 [6.8 ; 7.8] |
7.7 [7.2 ; 8.2] |
5.8 [5.3 ; 6.3] |
4.8 [4.4 ; 5.2]¥ |
| Teaching ≥ 400 beds (N = 10) |
10.5 [10.0 ; 11.1] |
11.3 [10.7 ; 11.9] |
9.1 [8.6 ; 9.6] |
8.9 [8.4 ; 9.4] |
6.7 [6.3 ; 7.2]¥ |
| Rehabilitation facilities (N = 6) |
3.0 [2.4 ; 3.7] |
3.3 [2.7 ; 4.0] |
2.9 [2.3 ; 3.6] |
3.4 [2.7 ; 4.2] |
1.7 [1.2 ; 2.2]¥ |
| Pediatric facilities (N = 2) |
2.5 [1.6 ; 3.5] |
3.9 [2.8 ; 5.2] |
3.2 [2.2 ; 4.4] |
3.4 [2.3 ; 4.7] |
3.3 [2.2 ; 4.6] |
|
Total (N = 95) * |
7.3 [7.1 ; 7.5] |
7.2 [7.0 ; 7.4] |
7.2 [7.0 ; 7.4] |
6.8 [6.6 ; 7.0] |
5.9 [5.7 ; 6.1]¥ |
¥ Significant statistical difference (p < 0.05) between healthcare-associated CDAD incidence rate of 2014-2015 and 2015-2016.
p65: Proportion of admitted patients aged 65 years or older.
* Number of facilities that participated in surveillance for at least 11 periods for each of the five years.
1 Data are those from facilities that participated in surveillance for at least 11 periods for each year between 2011-2012 and 2015-2016.
Description of Cases
In total, 4,529 cases of CDAD were reported of which 2,977 (65.7%) were healthcare-associated, either linked with a current or a previous hospitalisation (cat. 1a and 1b, respectively), and 230 cases which were associated with ambulatory care in the reporting facility (cat. 1c) (Table 5).
Table 5 – Distribution of CDAD Cases by Presumed Origin of Acquisition, Québec, 2015–2016 (N, %)
|
Category |
Origin of Acquisition |
N |
% |
|---|---|---|---|
|
1a |
Healthcare-associated with a current hospitalisation in the reporting facility |
1,998 |
44.1 |
|
1b |
Healthcare-associated with a previous hospitalisation in the reporting facility |
979 |
21.6 |
|
1c |
Healthcare-associated with ambulatory care in the reporting facility |
230 |
5.1 |
|
1d |
Healthcare-associated with long term unit in the reporting facility |
9 |
0.2 |
|
2 |
Healthcare-associated with another facility |
208 |
4.6 |
|
3 |
Community-associated |
909 |
20.1 |
|
4 |
Unknown origin |
196 |
4.3 |
|
Total |
4,529 |
100.0 |
Data related to complications were available in 2,728 of the 2,977 cases of HA-CDAD (91.6%). The 10-day case fatality rate (n = 219) was 8.0% whereas the 11 to 30-day case fatality rate (n = 162) was 5.9%. In addition to the 381 deaths that occurred within 30 days (14.0%), 23 colectomies (0.8%), 185 readmissions (6.8%) and 80 transfers to an intensive care unit (ICU) (2.9%) were reported (Table 6). The percentage of deaths within 30 days remains stable since 2011-2012, ranging from 14.0% to 17.4%.
Table 6 – Number of Deaths, Case Fatality Rate and Complications Related to Healthcare-associated CDAD (cat. 1a and 1b), Québec, 2011–2012 to 2015–2016 [N (%)]
|
|
2011-2012 |
2012-2013 |
2013-2014 |
2014-2015 |
2015-2016 |
|---|---|---|---|---|---|
| Number and percentage of CDAD cases with documented complications |
3 550 (94.0) |
3 483 (91.8) |
3 532 (95.7) |
3 150 (91.1) |
2 728 (91.6) |
| Number of facilities reporting complications |
91 |
88 |
90 |
87 |
84 |
| Deaths | |||||
| Death within 10 days |
305 (8.6) |
304 (8.7) |
322 (9.1) |
288 (9.1) |
219 (8.0) |
| Death within 30 days* |
545 (15.4) |
561 (16.1) |
534 (15.1) |
547 (17.4) |
381 (14.0) |
| Other complications | |||||
| Colectomy |
53 (1.5) |
33 (0.9) |
46 (1.3) |
37 (1.2) |
23 (0.8) |
| Readmission |
155 (4.4) |
182 (5.2) |
206 (5.8) |
205 (6.5) |
185 (6.8) |
| Admission to ICU |
98 (2.8) |
97 (2.8) |
110 (3.1) |
99 (3.1) |
80 (2.9) |
* The number of deaths within 30 days includes the number of deaths within 10 days.
Microbiology
A laboratory surveillance of C. difficile strains is performed by the Laboratoire de santé publique du Québec every year. Results will be presented in a separate report.
Data per Healthcare Facility
The HA-CDAD incidence rates by healthcare facility and healthcare facility category are shown in Figures 4 through 10.
Figure 4 – Healthcare-associated CDAD (cat. 1a and 1b) Incidence Rate per Healthcare Facilities and Incidence Rate by Healthcare Facility Category among non-Teaching Facilities with Fewer than 110 Beds, Québec, 2015–2016 (Incidence Rate per 10,000 Patient Days [95% CI])
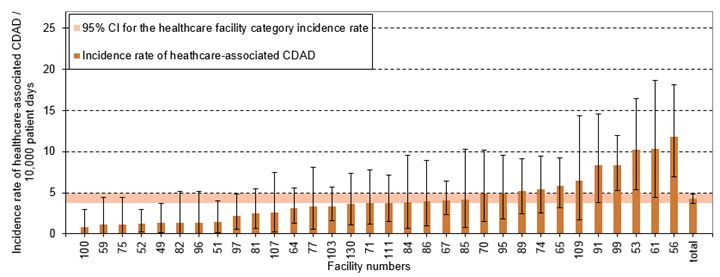
Figure 5 – Healthcare-associated CDAD (cat. 1a and 1b) Incidence Rate per Healthcare Facilities and Incidence Rate by Healthcare Facility Category among non-Teaching Facilities with 110 Beds and More and a Proportion of Admitted Patients Aged 65 Years or Older Below 45%, Québec, 2015–2016 (Incidence Rate per 10,000 Patient Days [95% CI])
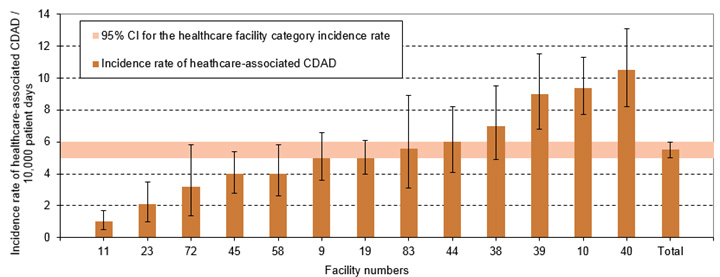
Figure 6 – Healthcare-associated CDAD (cat. 1a and 1b) Incidence Rate per Healthcare Facilities and Incidence Rate by Healthcare Facility Category among non-Teaching Facilities with 110 Beds and More and a Proportion of Admitted Patients Aged 65 Years or Older of 45% or More, Québec, 2015–2016 (Incidence Rate per 10,000 Patient Days [95% CI])
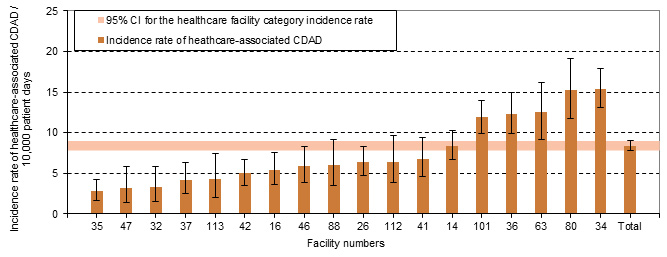
Figure 7 – Healthcare-associated CDAD (cat. 1a and 1b) Incidence Rate per Healthcare Facilities and Incidence Rate by Healthcare Facility Category among Teaching Facilities with Fewer than 400 Beds, Québec, 2015–2016 (Incidence Rate per 10,000 Patient Days [95% CI])
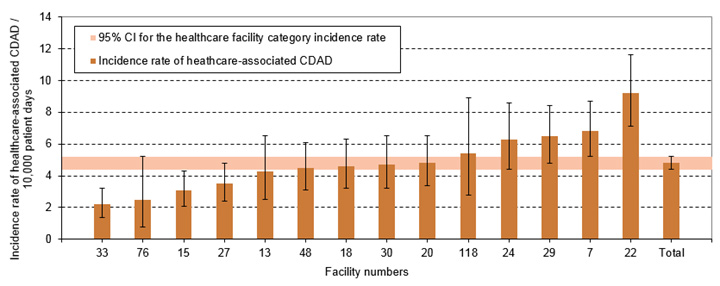
Figure 8 – Healthcare-associated CDAD (cat. 1a and 1b) Incidence Rate per Healthcare Facilities and Incidence Rate by Healthcare Facility Category among Teaching Facilities with 400 Beds or More, Québec, 2015–2016 (Incidence Rate per 10,000 Patient Days [95% CI])
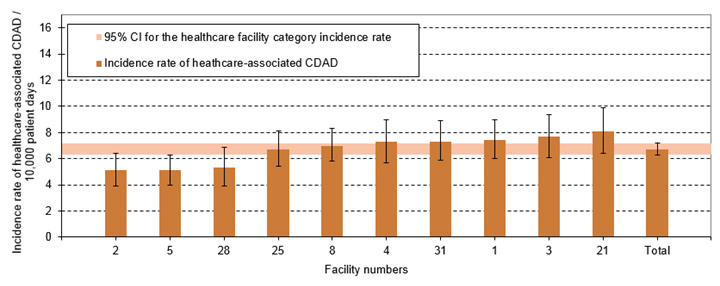
Figure 9 – Healthcare-associated CDAD (cat. 1a and 1b) Incidence Rate per Healthcare Facilities and Incidence Rate by Healthcare Facility Category among Rehabilitation Facilities, Québec, 2015–2016 (Incidence Rate per 10,000 Patient Days [95% CI])
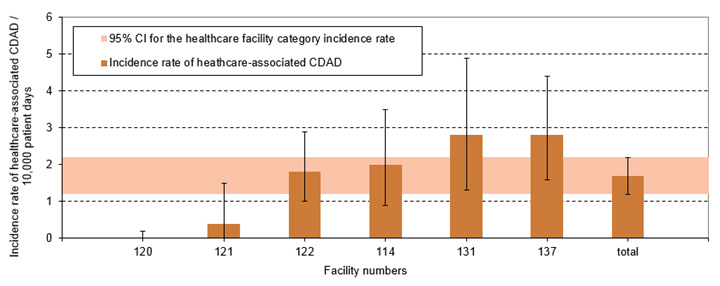
Figure 10 – Healthcare-associated CDAD (cat. 1a and 1b) Incidence Rate per Healthcare Facilities and Incidence Rate by Healthcare Facility Category among Pediatric Facilities, Québec, 2015–2016 (Incidence Rate per 10,000 Patient Days [95% CI])
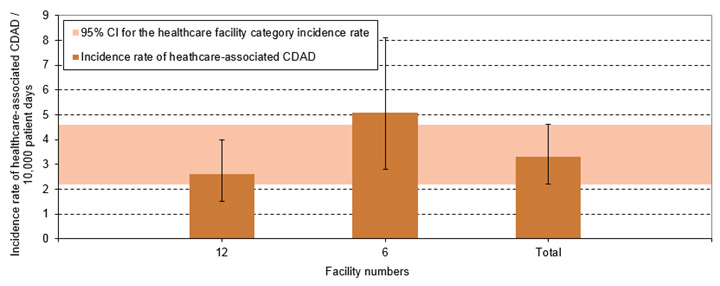
At the facility level, the HA-CDAD incidence rate ranged from 0 to 15.4 per 10,000 patient days in 2015–2016. The incidence rates for each participating institution over the past five years of surveillance are indicated in Table 7.
Overall, 14 facilities (14.7%) exhibited a significant decrease in their HA-CDAD incidence rate compared to 2014–2015, whereas 4 facilities (4.2%) experienced a significant increase in their incidence rate. Four regions (Saguenay-Lac-Saint-Jean, Capitale-Nationale, Montréal and Lanaudière) had a significant decrease in their HA-CDAD whereas two regions (Abitibi-Témiscamingue and Laurentides) had a significant increase. The provincial HA-CDAD incidence rate has decreased significantly in 2015-2016 as compared to 2014-2015.
Table 7 – Healthcare-associated CDAD (cat. 1a and 1b) Incidence Rate per Healthcare Facility, per Region Québec, 2011–2012 to 2015–2016 (Incidence Rate per 10,000 Patient Days [95% CI])
|
HR |
Facility |
Incidence rate of healthcare-associated CDAD per 10,000 patient days [95% CI] |
|||||
|---|---|---|---|---|---|---|---|
|
Number |
Name |
2011-2012 |
2012-2013 |
2013-2014 |
2014-2015 |
2015-2016 |
|
| 1
|
16 |
HOPITAL REGIONAL DE RIMOUSKI |
16.0 [12.8 ; 19.6] |
7.0 [5.0 ; 9.4] |
5.1 [3.3 ; 7.2] |
4.5 [2.8 ; 6.5] |
5.4 [3.6 ; 7.5] |
|
32 |
CENTRE HOSPITALIER REGIONAL DU GRAND-PORTAGE |
3.1 [1.5 ; 5.3] |
2.6 [1.1 ; 4.7] |
2.7 [1.2 ; 4.9] |
1.8 [0.6 ; 3.7] |
3.3 [1.5 ; 5.8] |
|
|
61 |
HOPITAL NOTRE-DAME-DE-FATIMA |
8.2 [3.5 ; 14.9] |
9.8 [4.4 ; 17.2] |
7.8 [2.8 ; 15.3] |
15.3 [8.1 ; 24.7] |
10.3 [4.4 ; 18.7] |
|
|
71 |
HOPITAL DE MATANE |
3.7 [1.2 ; 7.7] |
1.6 [0.1 ; 4.6] |
3.1 [0.8 ; 6.9] |
3.6 [1.1 ; 7.4] |
3.8 [1.2 ; 7.8] |
|
|
77 |
HOPITAL D'AMQUI |
17.8 [10.2 ; 27.6] |
9.7 [4.2 ; 17.6] |
6.2 [2.0 ; 12.8] |
5.7 [1.8 ; 11.8] |
3.3 [0.6 ; 8.1] |
|
|
84 |
HOPITAL DE NOTRE-DAME-DU-LAC |
7.1 [2.6 ; 13.9] |
0 |
2.4 [0.2 ; 6.9] |
8.7 [3.4 ; 16.3] |
3.9 [0.7 ; 9.6] |
|
|
|
|
BAS-SAINT-LAURENT |
10.3 [8.6 ; 12.2] |
5.3 [4.1 ; 6.7] |
4.3 [3.2 ; 5.6] |
4.9 [3.7 ; 6.2] |
4.8 [3.6 ; 6.1] |
| 2
|
20 |
HOPITAL DE CHICOUTIMI |
3.5 [2.4 ; 4.8] |
6.4 [4.8 ; 8.2] |
8.0 [6.3 ; 9.9] |
8.1 [6.3 ; 10.2] |
4.8 [3.4 ; 6.5]¥ |
|
67 |
HOPITAL ET CENTRE DE READAPTATION DE JONQUIERE |
3.6 [2.0 ; 5.7] |
3.0 [1.5 ; 4.9] |
10.1 [7.2 ; 13.5] |
6.4 [4.1 ; 9.2] |
4.1 [2.3 ; 6.4] |
|
|
74 |
HOPITAL DE DOLBEAU-MISTASSINI |
2.9 [1.0 ; 5.7] |
4.7 [2.0 ; 8.5] |
3.2 [1.0 ; 6.6] |
7.0 [3.5 ; 11.8] |
5.4 [2.5 ; 9.5] |
|
|
88 |
HOPITAL. CLSC ET CENTRE D'HEBERGEMENT DE ROBERVAL |
1.2 [0.3 ; 2.6] |
3.0 [1.4 ; 5.1] |
2.0 [0.7 ; 3.9] |
5.7 [3.3 ; 8.7] |
6.0 [3.5 ; 9.2] |
|
|
100 |
HOPITAL DE LA BAIE |
- |
- |
5.1 [2.0 ; 9.6] |
3.0 [0.8 ; 6.7] |
0.8 [0 ; 3.0] |
|
|
112 |
HOPITAL D'ALMA |
8.8 [5.8 ; 12.4] |
3.2 [1.5 ; 5.5] |
8.1 [5.3 ; 11.5] |
12.5 [8.8 ; 16.9] |
6.4 [3.8 ; 9.7]¥ |
|
|
|
SAGUENAY–LAC-SAINT-JEAN |
3.5 [2.8 ; 4.3] |
4.3 [3.5 ; 5.2] |
7.0 [5.9 ; 8.1] |
7.7 [6.6 ; 8.9] |
4.8 [3.9 ; 5.8]¥ |
|
| 3
|
2 |
HOPITAL DE L'ENFANT-JESUS |
6.9 [5.6 ; 8.4] |
6.8 [5.5 ; 8.3] |
5.0 [3.9 ; 6.3] |
6.1 [4.8 ; 7.5] |
5.1 [3.9 ; 6.4] |
|
7 |
PAVILLON L'HOTEL-DIEU DE QUEBEC |
9.9 [7.9 ; 12.1] |
7.7 [5.9 ; 9.7] |
13.7 [11.3 ; 16.3] |
9.2 [7.3 ; 11.4] |
6.8 [5.2 ; 8.7] |
|
|
24 |
HOPITAL DU SAINT-SACREMENT |
5.3 [3.6 ; 7.4] |
7.9 [5.8 ; 10.4] |
5.7 [3.9 ; 7.9] |
7.8 [5.6 ; 10.3] |
6.3 [4.4 ; 8.6] |
|
|
27 |
PAVILLON CENTRE HOSPITALIER DE L'UNIVERSITE LAVAL |
5.0 [3.7 ; 6.5] |
3.2 [2.2 ; 4.4] |
4.3 [3.1 ; 5.7] |
3.0 [2.0 ; 4.2] |
3.5 [2.4 ; 4.8] |
|
|
28 |
PAVILLON SAINT-FRANCOIS D'ASSISE |
11.3 [9.2 ; 13.6] |
16.1 [13.6 ; 18.8] |
14.3 [11.9 ; 16.9] |
11.7 [9.6 ; 14] |
5.3 [3.9 ; 6.9]¥ |
|
|
33 |
INSTITUT UNIV. DE CARDIOL. ET DE PNEUMO. DE QUEBEC |
8.7 [6.9 ; 10.7] |
6.1 [4.7 ; 7.7] |
5.2 [3.9 ; 6.7] |
2.4 [1.5 ; 3.5] |
2.2 [1.4 ; 3.2] |
|
|
59 |
HOPITAL DE BAIE-SAINT-PAUL |
5.5 [1.4 ; 12.2] |
1.4 [0 ; 5.5] |
1.2 [0 ; 4.7] |
0 |
1.1 [0 ; 4.4] |
|
|
86 |
HOPITAL DE LA MALBAIE |
14.4 [8.2 ; 22.3] |
4.3 [1.1 ; 9.5] |
8.0 [3.2 ; 15] |
5.0 [1.6 ; 10.3] |
4.0 [1.0 ; 8.9] |
|
|
|
CAPITALE-NATIONALE |
7.9 [7.2 ; 8.6] |
7.6 [6.9 ; 8.3] |
7.7 [7.0 ; 8.4] |
6.3 [5.7 ; 7.0] |
4.7 [4.2 ; 5.3]¥ |
|
| 4
|
23 |
HOTEL-DIEU D'ARTHABASKA |
6.9 [4.9 ; 9.3] |
6.4 [4.5 ; 8.7] |
3.4 [2.0 ; 5.2] |
2.7 [1.5 ; 4.3] |
2.1 [1.0 ; 3.5] |
|
31 |
PAVILLON SAINTE-MARIE |
11.9 [10.0 ; 13.9] |
14.9 [12.9 ; 17.1] |
8.8 [7.2 ; 10.5] |
8.3 [6.8 ; 10.0] |
7.3 [5.9 ; 8.9] |
|
|
41 |
HOPITAL DU CENTRE-DE-LA-MAURICIE |
4.0 [2.4 ; 6.0] |
3.0 [1.6 ; 4.8] |
4.1 [2.5 ; 6.1] |
4.8 [3.0 ; 7.0] |
6.8 [4.6 ; 9.4] |
|
|
44 |
HOPITAL SAINTE-CROIX |
10.6 [8.1 ; 13.4] |
4.4 [2.9 ; 6.3] |
4.3 [2.8 ; 6.1] |
3.9 [2.4 ; 5.7] |
6.0 [4.1 ; 8.2] |
|
|
85 |
CSSS DU HAUT-SAINT-MAURICE |
4.0 [0.8 ; 9.8] |
8.5 [3.1 ; 16.7] |
4.3 [0.8 ; 10.5] |
2.9 [0.3 ; 8.3] |
4.2 [0.8 ; 10.3] |
|
|
|
|
MAURICIE ET CENTRE-DU-QUÉBEC |
9.2 [8.1 ; 10.3] |
9.2 [8.1 ; 10.3] |
6.1 [5.2 ; 7.0] |
5.7 [4.9 ; 6.6] |
5.9 [5.0 ; 6.8] |
| 5
|
15 |
HOPITAL FLEURIMONT |
2.4 [1.6 ; 3.4] |
2.5 [1.7 ; 3.5] |
3.3 [2.3 ; 4.5] |
4.2 [3.0 ; 5.6] |
3.1 [2.1 ; 4.3] |
|
30 |
HOTEL-DIEU DE SHERBROOKE |
3.7 [2.4 ; 5.3] |
3.0 [1.8 ; 4.4] |
4.5 [3.0 ; 6.3] |
3.8 [2.5 ; 5.4] |
4.7 [3.2 ; 6.5] |
|
|
46 |
HOPITAL DE GRANBY |
3.7 [2.1 ; 5.7] |
11.5 [8.5 ; 15.0] |
6.7 [4.5 ; 9.4] |
4.3 [2.6 ; 6.4] |
5.9 [3.9 ; 8.3] |
|
|
49 |
CSSS DE MEMPHREMAGOG |
4.4 [1.4 ; 9.1] |
6.1 [2.4 ; 11.5] |
2.8 [0.7 ; 6.3] |
0.7 [0 ; 2.7] |
1.3 [0.1 ; 3.7] |
|
|
75 |
CSSS DU GRANIT |
0 |
3.1 [0.8 ; 6.9] |
1.0 [0 ; 4.0] |
2.2 [0.2 ; 6.3] |
1.1 [0 ; 4.4] |
|
|
99 |
HOPITAL BROME-MISSISQUOI-PERKINS |
6.3 [3.7 ; 9.6] |
5.6 [3.2 ; 8.7] |
2.8 [1.2 ; 5.1] |
13.6 [9.6 ; 18.3] |
8.3 [5.3 ; 12.0] |
|
|
|
ESTRIE |
3.3 [2.7 ; 4.0] |
4.5 [3.7 ; 5.3] |
4.0 [3.3 ; 4.8] |
4.9 [4.1 ; 5.8] |
4.4 [3.6 ; 5.2] |
|
| 6
|
3 |
GLEN - ROYAL VICTORIA |
14.6 [12.5 ; 16.9] |
13.9 [11.8 ; 16.2] |
10.9 [9.0 ; 13] |
11.3 [9.4 ; 13.4] |
7.7 [6.1 ; 9.4]¥ |
|
4 |
HOPITAL NOTRE-DAME DU CHUM |
6.4 [5.0 ; 7.9] |
6.7 [5.3 ; 8.3] |
9.8 [8.1 ; 11.7] |
7.3 [5.8 ; 9.0] |
7.3 [5.7 ; 9.0] |
|
|
5 |
HOPITAL GENERAL JUIF |
15.7 [13.9 ; 17.6] |
16.4 [14.5 ; 18.4] |
8.3 [7.0 ; 9.8] |
6.8 [5.6 ; 8.1] |
5.1 [4.0 ; 6.3]¥ |
|
|
6 |
GLEN - ENFANTS |
3.3 [1.6 ; 5.6] |
3.2 [1.4 ; 5.6] |
5.9 [3.4 ; 9.2] |
5.0 [2.7 ; 7.9] |
5.1 [2.8 ; 8.1] |
|
|
8 |
PAV. MAISONNEUVE/PAV. MARCEL-LAMOUREUX |
11.3 [9.8 ; 12.9] |
10.7 [9.2 ; 12.3] |
10.8 [9.3 ; 12.4] |
8.0 [6.7 ; 9.4] |
7.0 [5.8 ; 8.3] |
|
|
12 |
CHU SAINTE-JUSTINE |
2.1 [1.2 ; 3.3] |
4.2 [2.8 ; 5.8] |
2.2 [1.2 ; 3.4] |
2.7 [1.6 ; 4.1] |
2.6 [1.5 ; 4.0] |
|
|
13 |
INSTITUT DE CARDIOLOGIE DE MONTRÉAL |
7.2 [4.9 ; 10.0] |
7.2 [4.9 ; 10.0] |
6.3 [4.1 ; 8.9] |
2.8 [1.4 ; 4.6] |
4.3 [2.5 ; 6.5] |
|
|
21 |
HOPITAL SAINT-LUC DU CHUM |
9.8 [7.9 ; 11.9] |
8.5 [6.8 ; 10.4] |
9.2 [7.4 ; 11.2] |
11.9 [9.9 ; 14.1] |
8.1 [6.4 ; 9.9]¥ |
|
|
22 |
HOTEL-DIEU DU CHUM |
15.4 [12.8 ; 18.3] |
11.2 [9.0 ; 13.6] |
14.0 [11.5 ; 16.7] |
8.3 [6.4 ; 10.5] |
9.2 [7.1 ; 11.6] |
|
|
25 |
HOPITAL DU SACRE-COEUR DE MONTRÉAL |
8.7 [7.3 ; 10.2] |
9.0 [7.6 ; 10.6] |
7.7 [6.4 ; 9.2] |
12.7 [10.9 ; 14.6] |
6.7 [5.4 ; 8.1]¥ |
|
|
26 |
HOPITAL DE VERDUN |
8.1 [6.2 ; 10.2] |
8.9 [6.9 ; 11.2] |
6.6 [4.9 ; 8.6] |
7.7 [5.8 ; 9.9] |
6.4 [4.7 ; 8.3] |
|
|
29 |
HOPITAL GENERAL DE MONTRÉAL |
14.8 [12.6 ; 17.2] |
12.5 [10.4 ; 14.7] |
11.9 [9.7 ; 14.3] |
9.1 [7.2 ; 11.2] |
6.5 [4.8 ; 8.4] |
|
|
34 |
HOPITAL SANTA CABRINI |
9.1 [7.3 ; 11.0] |
7.7 [6.1 ; 9.5] |
9.5 [7.7 ; 11.4] |
14.7 [12.5 ; 17.1] |
15.4 [13.1 ; 17.9] |
|
|
36 |
HOPITAL GENERAL DU LAKESHORE |
5.8 [4.1 ; 7.8] |
8.4 [6.4 ; 10.7] |
10.2 [7.9 ; 12.7] |
11.1 [8.7 ; 13.7] |
12.3 [9.9 ; 15.0] |
|
|
38 |
HOPITAL JEAN-TALON |
7.5 [5.4 ; 9.9] |
5.3 [3.5 ; 7.4] |
7.9 [5.7 ; 10.5] |
3.2 [1.9 ; 4.9] |
7.0 [4.9 ; 9.5]¥ |
|
|
48 |
CENTRE HOSPITALIER DE ST. MARY |
4.4 [3.1 ; 6.0] |
8.2 [6.3 ; 10.3] |
4.7 [3.3 ; 6.3] |
6.2 [4.6 ; 8.0] |
4.5 [3.1 ; 6.1] |
|
|
76 |
HOPITAL DE LACHINE |
8.4 [5.0 ; 12.7] |
8.8 [5.3 ; 13.2] |
9.8 [5.9 ; 14.7] |
4.0 [1.6 ; 7.5] |
2.5 [0.8 ; 5.2] |
|
|
80 |
HOPITAL FLEURY |
7.4 [5.1 ; 10.2] |
5.5 [3.5 ; 7.9] |
13.3 [10.1 ; 16.9] |
13.1 [10.0 ; 16.6] |
15.2 [11.8 ; 19.1] |
|
|
83 |
HOPITAL DE LASALLE |
12.0 [8.0 ; 16.8] |
7.9 [4.7 ; 11.9] |
9.4 [5.9 ; 13.7] |
11.6 [7.6 ; 16.4] |
5.6 [3.1 ; 8.9]¥ |
|
|
114 |
VILLA MEDICA |
3.1 [1.7 ; 4.9] |
5.8 [3.7 ; 8.3] |
3.5 [2.0 ; 5.4] |
4.6 [2.8 ; 6.8] |
2.0 [0.9 ; 3.5]¥ |
|
|
116 |
INSTITUT THORACIQUE DE MONTRÉAL |
4.9 [2.4 ; 8.2] |
8.5 [5.1 ; 12.8] |
8.9 [5.3 ; 13.5] |
4.6 [1.8 ; 8.7] |
- |
|
|
118 |
HOPITAL NEUROLOGIQUE DE MONTREAL |
4.0 [1.9 ; 6.9] |
4.7 [2.4 ; 7.7] |
3.6 [1.6 ; 6.3] |
5.3 [2.8 ; 8.6] |
5.4 [2.8 ; 8.9] |
|
|
120 |
HOPITAL RICHARDSON |
0 |
0 |
0 |
0 |
0 |
|
|
121 |
HOPITAL CATHERINE-BOOTH |
7.4 [4.6 ; 10.8] |
5.9 [3.5 ; 9.0] |
1.7 [0.5 ; 3.5] |
5.6 [3.2 ; 8.7] |
0.4 [0 ; 1.5]¥ |
|
|
122 |
HOPITAL MARIE CLARAC |
2.9 [1.8 ; 4.3] |
3.4 [2.1 ; 4.9] |
2.6 [1.5 ; 4.0] |
2.4 [1.4 ; 3.7] |
1.8 [1.0 ; 2.9] |
|
|
137 |
INSTITUT DE READAPTATION GINGRAS-LINDSAY-DE-MONTRÉAL |
2.4 [1.3 ; 3.8] |
3.8 [2.4 ; 5.6] |
4.6 [3.0 ; 6.6] |
4.7 [3.0 ; 6.7] |
2.8 [1.6 ; 4.4] |
|
|
|
|
MONTRÉAL |
9.0 [8.6 ; 9.4] |
8.9 [8.5 ; 9.3] |
8.2 [7.8 ; 8.6] |
8.2 [7.8 ; 8.6] |
6.7 [6.3 ; 7.1]¥ |
| 7
|
39 |
HOPITAL DE GATINEAU |
4.8 [3.2 ; 6.7] |
5.6 [3.9 ; 7.6] |
6.2 [4.4 ; 8.2] |
10.6 [8.2 ; 13.4] |
9.0 [6.8 ; 11.5] |
|
40 |
HOPITAL DE HULL |
2.1 [1.2 ; 3.3] |
11.1 [8.8 ; 13.7] |
10.2 [7.9 ; 12.8] |
8.3 [6.2 ; 10.7] |
10.5 [8.2 ; 13.1] |
|
|
51 |
HOPITAL DE MANIWAKI |
4.1 [1.5 ; 8.0] |
7.4 [3.7 ; 12.4] |
5.3 [2.3 ; 9.6] |
0.6 [0 ; 2.4] |
1.4 [0.1 ; 4.0] |
|
|
95 |
HOPITAL DU PONTIAC |
1.5 [0.2 ; 4.2] |
10.1 [5.5 ; 16.1] |
5.2 [2.1 ; 9.8] |
5.7 [2.3 ; 10.7] |
4.9 [1.8 ; 9.6] |
|
|
111 |
HOPITAL DE PAPINEAU |
3.1 [1.1 ; 6.1] |
1.0 [0.1 ; 2.9] |
2.5 [0.8 ; 5.1] |
3.1 [1.1 ; 6.1] |
3.8 [1.5 ; 7.1] |
|
|
|
OUTAOUAIS |
3.2 [2.4 ; 4.1] |
7.7 [6.5 ; 9.0] |
7.1 [5.9 ; 8.4] |
7.6 [6.4 ; 9.0] |
8.1 [6.8 ; 9.5] |
|
| 8
|
47 |
HOPITAL DE ROUYN-NORANDA |
3.4 [1.5 ; 6.1] |
2.0 [0.6 ; 4.1] |
3.9 [1.8 ; 6.8] |
2.0 [0.6 ; 4.1] |
3.2 [1.4 ; 5.8] |
|
52 |
HOPITAL D'AMOS |
8.8 [5.5 ; 12.9] |
2.9 [1.1 ; 5.5] |
3.3 [1.3 ; 6.2] |
0.4 [0 ; 1.7] |
1.2 [0.2 ; 3.0] |
|
|
65 |
HOPITAL ET CLSC DE VAL-D'OR |
5.3 [3.0 ; 8.3] |
2.5 [1.0 ; 4.7] |
0.7 [0.1 ; 2.0] |
2.5 [1.0 ; 4.7] |
5.8 [3.2 ; 9.2] |
|
|
70 |
CENTRE DE SOINS DE COURTE DUREE LA SARRE (CSCD) |
4.7 [1.5 ; 9.7] |
1.9 [0.2 ; 5.5] |
6.1 [2.4 ; 11.4] |
2.0 [0.2 ; 5.7] |
4.9 [1.5 ; 10.2] |
|
|
82 |
PAVILLON SAINTE-FAMILLE |
0 |
1.3 [0 ; 5.2] |
2.8 [0.3 ; 8.0] |
0 |
1.3 [0 ; 5.2] |
|
|
|
ABITIBI-TÉMISCAMINGUE |
5.2 [3.9 ; 6.7] |
2.3 [1.4 ; 3.4] |
2.9 [1.9 ; 4.1] |
1.6 [0.9 ; 2.5] |
3.4 [2.3 ; 4.7]¥ |
|
| 9
|
64 |
HOPITAL LE ROYER |
2.8 [1.2 ; 5.1] |
4.0 [2.0 ; 6.7] |
3.5 [1.6 ; 6.1] |
2.3 [0.8 ; 4.5] |
3.1 [1.3 ; 5.6] |
|
72 |
HOPITAL ET CENTRE D'HEBERGEMENT DE SEPT-ILES |
4.6 [2.2 ; 7.9] |
3.7 [1.6 ; 6.7] |
1.6 [0.4 ; 3.6] |
3.6 [1.6 ; 6.3] |
3.2 [1.4 ; 5.8] |
|
|
|
CÔTE-NORD |
3.5 [2.1 ; 5.3] |
3.8 [2.3 ; 5.7] |
2.6 [1.4 ; 4.2] |
2.9 [1.6 ; 4.6] |
3.1 [1.8 ; 4.8] |
|
| 10 |
96 |
CENTRE DE SANTE DE CHIBOUGAMAU |
0 |
0 |
3.1 [0.3 ; 8.9] |
1.5 [0 ; 5.8] |
1.3 [0 ; 5.2] |
|
|
NORD-DU-QUÉBEC |
0 |
0 |
3.1 [0.3 ; 8.9] |
1.5 [0 ; 5.8] |
1.3 [0 ; 5.2] |
|
| 11 |
53 |
HOPITAL DE CHANDLER |
2.7 [0.7 ; 6.0] |
0.7 [0 ; 2.8] |
3.6 [1.1 ; 7.4] |
10.4 [5.8 ; 16.3] |
10.2 [5.4 ; 16.5] |
|
91 |
HOPITAL HOTEL-DIEU DE GASPÉ |
4.1 [1.3 ; 8.5] |
7.7 [3.3 ; 14.0] |
3.8 [1.0 ; 8.5] |
6.0 [2.2 ; 11.8] |
8.3 [3.8 ; 14.6] |
|
|
97 |
HOPITAL DE MARIA |
1.5 [0.3 ; 3.7] |
7.6 [4.3 ; 11.8] |
10.0 [5.9 ; 15.2] |
5.0 [2.4 ; 8.6] |
2.2 [0.6 ; 4.9] |
|
|
107 |
HOPITAL DE L'ARCHIPEL |
3.8 [0.7 ; 9.3] |
1.5 [0 ; 5.8] |
4.3 [0.8 ; 10.5] |
4.0 [0.8 ; 9.8] |
2.6 [0.2 ; 7.5] |
|
|
109 |
HOPITAL DE SAINTE-ANNE-DES-MONTS |
2.4 [0.2 ; 6.9] |
2.8 [0.3 ; 8.0] |
1.2 [0 ; 4.8] |
2.5 [0.2 ; 7.2] |
6.5 [1.7 ; 14.4] |
|
|
|
GASPÉSIE–ÎLES-DE-LA-MADELEINE |
2.7 [1.6 ; 4.1] |
4.7 [3.1 ; 6.6] |
5.4 [3.7 ; 7.5] |
6.0 [4.2 ; 8.1] |
5.8 [4.0 ; 8.0] |
|
| 12 |
18 |
HOTEL-DIEU DE LÉVIS |
8.7 [6.8 ; 10.9] |
13.1 [10.7 ; 15.7] |
10.9 [8.7 ; 13.3] |
6.4 [4.7 ; 8.3] |
4.6 [3.2 ; 6.3] |
|
63 |
HOPITAL DE SAINT-GEORGES |
8.5 [6.1 ; 11.3] |
5.4 [3.4 ; 7.8] |
12.3 [9.1 ; 16.0] |
12.4 [9.2 ; 16.1] |
12.5 [9.2 ; 16.2] |
|
|
89 |
HOPITAL DE MONTMAGNY |
7.4 [4.3 ; 11.3] |
9.9 [6.1 ; 14.6] |
11.4 [7.1 ; 16.8] |
4.3 [1.8 ; 7.8] |
5.2 [2.4 ; 9.1] |
|
|
113 |
HOPITAL DE THETFORD MINES |
4.9 [2.6 ; 7.9] |
5.1 [2.8 ; 8.1] |
8.0 [4.9 ; 11.9] |
10.6 [7.0 ; 14.9] |
4.3 [2.0 ; 7.4]¥ |
|
|
|
CHAUDIÈRE-APPALACHES |
7.9 [6.6 ; 9.3] |
9.5 [8.1 ; 11.0] |
10.9 [9.3 ; 12.6] |
8.3 [7.0 ; 9.8] |
6.6 [5.4 ; 7.9] |
|
| 13 |
19 |
HOPITAL CITE DE LA SANTE |
6.8 [5.6 ; 8.1] |
5.7 [4.6 ; 6.9] |
4.1 [3.2 ; 5.1] |
4.7 [3.7 ; 5.8] |
5.0 [4.0 ; 6.1] |
|
131 |
HOPITAL JUIF DE READAPTATION |
2.5 [1.2 ; 4.2] |
1.5 [0.8 ; 2.5] |
2.9 [1.4 ; 4.9] |
1.5 [0.5 ; 3.1] |
2.8 [1.3 ; 4.9] |
|
|
|
LAVAL |
5.9 [4.9 ; 7.0] |
4.4 [3.6 ; 5.3] |
3.8 [3.0 ; 4.7] |
4.2 [3.4 ; 5.1] |
4.7 [3.8 ; 5.7] |
|
| 14 |
11 |
HOPITAL PIERRE-LE GARDEUR |
1.7 [1.0 ; 2.6] |
0.8 [0.3 ; 1.4] |
2.0 [1.2 ; 2.9] |
1.1 [0.6 ; 1.8] |
1.0 [0.5 ; 1.7] |
|
14 |
CENTRE HOSPITALIER REGIONAL DE LANAUDIERE |
10.5 [8.5 ; 12.8] |
7.6 [5.9 ; 9.5] |
16.1 [13.6 ; 18.9] |
15.7 [13.3 ; 18.3] |
8.4 [6.7 ; 10.3]¥ |
|
|
LANAUDIÈRE |
5.8 [4.8 ; 6.9] |
4 [3.1 ; 5.0] |
8.4 [7.2 ; 9.7] |
7.8 [6.6 ; 9.1] |
4.4 [3.5 ; 5.3]¥ |
||
| 15 |
45 |
HOPITAL DE SAINT-EUSTACHE |
7.3 [5.5 ; 9.4] |
4.8 [3.4 ; 6.4] |
5.7 [4.2 ; 7.4] |
5.4 [4.0 ; 7.0] |
4.0 [2.8 ; 5.4] |
|
56 |
CSSS D'ARGENTEUIL |
13.8 [8.5 ; 20.3] |
16.5 [10.6 ; 23.8] |
14.2 [8.7 ; 21.1] |
5.0 [2.0 ; 9.4] |
11.8 [6.9 ; 18.1]¥ |
|
|
81 |
HOPITAL DE MONT-LAURIER |
5.7 [2.7 ; 9.8] |
3.9 [1.6 ; 7.3] |
3.5 [1.2 ; 6.9] |
0.6 [0 ; 2.3] |
2.5 [0.7 ; 5.5] |
|
|
101 |
HOPITAL REGIONAL DE SAINT-JEROME |
12.0 [9.9 ; 14.2] |
8.3 [6.6 ; 10.1] |
8.9 [7.2 ; 10.8] |
8.5 [6.9 ; 10.3] |
11.9 [9.9 ; 14.0]¥ |
|
|
103 |
HOPITAL LAURENTIEN |
4.9 [2.7 ; 7.8] |
3.2 [1.5 ; 5.6] |
3.7 [1.8 ; 6.3] |
2.5 [1.0 ; 4.7] |
3.3 [1.6 ; 5.7] |
|
|
|
LAURENTIDES |
9.3 [8.1 ; 10.6] |
6.7 [5.7 ; 7.8] |
7.1 [6.1 ; 8.2] |
6.1 [5.2 ; 7.1] |
7.6 [6.6 ; 8.7]¥ |
|
| 16 |
1 |
HOPITAL CHARLES LEMOYNE |
7.0 [5.6 ; 8.5] |
10.4 [8.7 ; 12.2] |
8.3 [6.8 ; 10.0] |
7.0 [5.6 ; 8.5] |
7.4 [6.0 ; 9.0] |
|
9 |
HOPITAL DU HAUT-RICHELIEU |
6.9 [5.2 ; 8.8] |
10.7 [8.7 ; 12.9] |
17.1 [14.5 ; 19.9] |
6.5 [4.9 ; 8.3] |
5.0 [3.6 ; 6.6] |
|
|
10 |
HOPITAL PIERRE-BOUCHER |
5.3 [4.0 ; 6.8] |
3.7 [2.6 ; 5.0] |
4.4 [3.2 ; 5.8] |
6.1 [4.7 ; 7.7] |
9.4 [7.7 ; 11.3]¥ |
|
|
35 |
HOPITAL HONORE-MERCIER |
4.5 [3.0 ; 6.3] |
6.0 [4.3 ; 8.0] |
2.7 [1.6 ; 4.1] |
3.6 [2.3 ; 5.2] |
2.8 [1.7 ; 4.2] |
|
|
37 |
HOTEL-DIEU DE SOREL |
4.1 [2.5 ; 6.1] |
3.0 [1.7 ; 4.7] |
1.6 [0.7 ; 2.9] |
2.7 [1.4 ; 4.4] |
4.2 [2.5 ; 6.3] |
|
|
42 |
CENTRE HOSPITALIER ANNA-LABERGE |
2.8 [1.7 ; 4.2] |
2.1 [1.2 ; 3.3] |
7.5 [5.7 ; 9.5] |
8.0 [6.1 ; 10.2] |
5.0 [3.5 ; 6.7]¥ |
|
|
58 |
HOPITAL DU SUROIT |
2.1 [1.1 ; 3.4] |
4.3 [2.8 ; 6.1] |
3.0 [1.8 ; 4.5] |
6.9 [4.9 ; 9.2] |
4.0 [2.6 ; 5.8]¥ |
|
|
130 |
HOPITAL BARRIE MEMORIAL |
8.8 [4.2 ; 15.1] |
7.7 [3.7 ; 13.2] |
7.1 [3.2 ; 12.5] |
1.4 [0.1 ; 4.1] |
3.6 [1.1 ; 7.4] |
|
|
|
|
MONTÉRÉGIE |
5.1 [4.5 ; 5.7] |
6.4 [5.8 ; 7.1] |
7.1 [6.4 ; 7.8] |
6.0 [5.4 ; 6.6] |
5.9 [5.3 ; 6.5] |
|
|
|
Total |
7.3 [7.1 ; 7.5] |
7.2 [7.0 ; 7.4] |
7.2 [7.0 ; 7.4] |
6.8 [6.6 ; 7.0] |
5.9 [5.7 ; 6.1]¥ |
HR: health region. * Significant statistical difference (p < 0.05) between incidence rates for Periods 1 through 13. 2014–2015 and 2015–2016. When the incidence rate is 0, the confidence interval [CI] is not calculated.
Author
Comité de surveillance provinciale des infections nosocomiales (SPIN)
Editorial Committee
Christophe Garenc, Direction des risques biologiques et de la santé au travail, Institut national de santé publique du Québec
Yves Longtin, Hôpital général juif Sir Mortimer B. Davis
Danielle Moisan, Centre hospitalier régional du Grand-Portage
Muleka Ngenda-Muadi, Direction des risques biologiques et de la santé au travail, Institut national de santé publique du Québec
Isabelle Rocher, Direction des risques biologiques et de la santé au travail, Institut national de santé publique du Québec
Mélissa Trudeau, Direction des risques biologiques et de la santé au travail, Institut national de santé publique du Québec
Jasmin Villeneuve, Direction des risques biologiques et de la santé au travail, Institut national de santé publique du Québec