Methicillin-Resistant Staphylococcus aureus (MRSA) Bloodstream Infections: Surveillance, 2015-2016
 Methicillin-Resistant Staphylococcus aureus (MRSA) Bloodstream Infections
Surveillance results: 2015-2016
From April 1, 2015, to March 31, 2016, 89 healthcare facilities participated in the surveillance of methicillin-resistant Staphylococcus aureus (MRSA) bloodstream infections, for a combined total of 4,851,752 inpatient days (Table 1). Together, these facilities reported 65 cases of healthcare-associated MRSA bloodstream infections (HA-MRSA-BSI). The incidence rate was 0.13 per 10,000 patient-days. This incidence rate of HA-MRSA-BSI has declined over the past five years. The proportion of methicillin resistance in healthcare-associated S. aureus bloodstream infections was 12.6%. Data was extracted on May 31st, 2016. For all results, only facilities that participated in at least 11 periods are included in analyzes. This year, new healthcare facility categories have been defined taking into account the teaching vocation and the number of beds of participating facilities. These new healthcare facility categories have been applied to previous years when these are used for comparisons.
Updated: February 28, 2017
Version française
Table 1 – Participation of Healthcare Facilities in the Surveillance of MRSA Bloodstream Infections, Québec, 2011-2012 to 2015-2016
|
|
2011-2012 |
2012-2013 |
2013-2014 |
2014-2015 |
2015-2016 |
|---|---|---|---|---|---|
|
Facilities (N) |
88 |
88 |
87 |
89 |
89 |
|
Admissions (N) |
629,067 |
639,647 |
636,379 |
644,643 |
660,258 |
|
Inpatient days (N) |
4,980,856 |
5,005,289 |
4,837,194 |
4,856,680 |
4,851,752 |
|
MRSA bloodstream infections |
|||||
|
Healthcare-associated (cat. 1a and 1b) (N) |
144 |
147 |
109 |
106 |
65 |
|
Total (cat. 1a, 1b, 1c, 1d, 2, 3 and 4) (N) |
300 |
300 |
267 |
273 |
258 |
|
S. aureus bloodstream infection |
|||||
|
Healthcare-associated (cat. 1a and 1b) (N) |
610 |
660 |
569 |
574 |
507 |
|
Total (cat. 1a, 1b, 1c, 1d, 2, 3 and 4) (N) |
1,774 |
1,941 |
1,821 |
1,954 |
2,064 |
Incidence Rates
In 2015-2016, the incidence rate for HA-MRSA-BSI was 0.13 per 10,000 patient-days (Figure 1 and Table 2). The incidence rate of HA-MRSA-BSI in pediatric facilities was equal to 0 in 2015-2016.
Figure 1 – Incidence Rate of Healthcare-associated MRSA (cat. 1a and 1b), by Type of Healthcare Facility, Québec, 2015-2016 (Incidence Rate per 10,000 Patient-Days [95% CI])
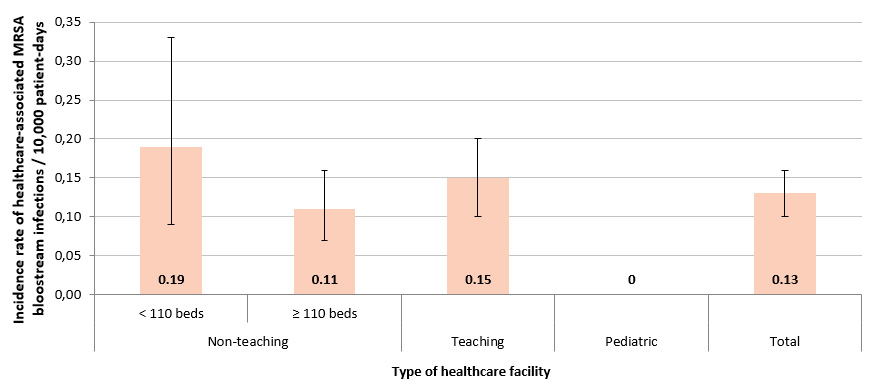
Table 2 – Percentile Distribution and Incidence Rate of Healthcare-Associated MRSA Bloodstream Infections (cat. 1a and 1b) by type of Healthcare Facility, Québec, 2015-2016 (Incidence Rate per 10,000 Patient-Days [95% CI])
|
Type of Healthcare Facility |
Min. |
25% |
50% |
75% |
90% |
Max. |
Incidence Rate [95% CI] |
|---|---|---|---|---|---|---|---|
|
Non-teaching facilities |
|||||||
|
< 110 beds (N = 32) |
0 |
0 |
0 |
0 |
0.58 |
2.16 |
0.19 [0.09 ; 0.33] |
|
≥ 110 beds (N = 31) |
0 |
0 |
0.03 |
0.19 |
0.25 |
0.51 |
0.11 [0.07 ; 0.16] |
|
Teaching facilities (N = 24) |
0 |
0 |
0.12 |
0.25 |
0.39 |
0.49 |
0.15 [0.10 ; 0.20] |
|
Pediatric facilities (N = 2) |
0 |
0 |
0 |
0 |
0 |
0 |
0 |
|
Total (N = 89) |
0 |
0 |
0 |
0.18 |
0.41 |
2.16 |
0.13 [0.10 ; 0.16] |
Incidence Rate Trends
The incidence rate of HA-MRSA-BSI decreased in the past ten years (Figure 2). The incidence rate of HA-MRSA-BSI was 0.54 per 10,000 patient-days during the first year of mandatory surveillance (2006-2007).
Figure 2 – Incidence Rate of Healthcare-associated Methicillin-Resistant (MRSA) and Methicillin-Sensitive (MSSA) Staphylococcus aureus Bloodstream Infections (cat. 1a and 1b) for Participating Healthcare Facilities, Québec, 2006-2007 to 2015-2016 (Incidence Rate per 10,000 Patient-Days [95% CI]) (N = 82)
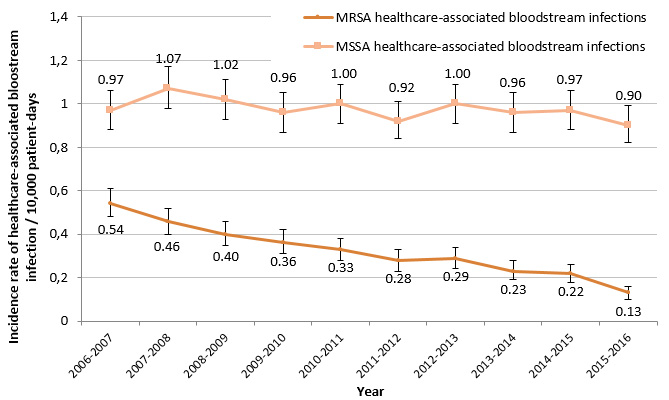
Note: data analyzed are those from healthcare facilities that participated in the surveillance from 2006-2007 to 2015-2016 and at least 11 periods between 2007-2008 and 2015-2016.
Table 3 – Incidence Rate of Healthcare-associated MRSA Bloodstream Infections (cat. 1a and 1b) by type of Healthcare Facility for Participating Healthcare Facilities, Québec, 2011-2012 to 2015-2016 (Incidence Rate per 10,000 Patient-Days [95% CI]) (N = 85)
|
Facilities |
2011-2012 |
2012-2013 |
2013-2014 |
2014-2015 |
2015-2016 |
|---|---|---|---|---|---|
|
Non-teaching facilities |
|||||
|
< 110 beds (N = 30) |
0.33 [0.21 ; 0.48] |
0.20 [0.11 ; 0.32] |
0.10 [0.04 ; 0.19] |
0.20 [0.11 ; 0.32] |
0.14 [0.05 ; 0.27] |
|
≥ 110 beds (N = 31) |
0.21 [0.15 ; 0.28] |
0.28 [0.21 ; 0.36] |
0.17 [0.12 ; 0.23] |
0.22 [0.16 ; 0.29] |
0.11 [0.07 ; 0.16] |
|
Teaching facilities (N = 22) |
0.36 [0.29 ; 0.44] |
0.33 [0.26 ; 0.41] |
0.32 [0.25 ; 0.40] |
0.23 [0.17 ; 0.30] |
0.15 [0.10 ; 0.21] |
|
Pediatric facilitites (N = 2) |
0 |
0.31 [0.08 ; 0.68] |
0 |
0.08 [0 ; 0.31] |
0 |
|
Total (N = 85)* |
0.29 [0.24 ; 0.34] |
0.30 [0.25 ; 0.35] |
0.22 [0.18 ; 0.26] |
0.22 [0.18 ; 0.26] |
0.13 [0.10 ; 0.16]¥ |
* Number of healthcare facilities that participated in the surveillance for at least 11 periods in each five years.
¥ Significant statistical difference (p < 0.05) between healthcare-associated MRSA bloodstream infections of 2014-2015 and 2015-2016.
Number of Cases
In total. 258 cases of MRSA bloodstream infections were reported. of which 111 (43.0%) were healthcare-associated (cat. 1a, 1b, 1c, 1d, 2) and 91 (35.3%) were related to the reporting facility (cat. 1a,. 1b, 1c, 1d) (Table 4)
Table 4 – Cases of MRSA and S. aureus Bloodstream Infections by Presumed Origin of Acquisition. Québec. 2015-2016 (N. %)
|
Category |
Origin of Acquisition |
2015-2016 |
|||
|---|---|---|---|---|---|
|
MRSA |
S. aureus |
||||
|
N |
%* |
N |
%* |
||
|
1a |
Healthcare-associated with a current hospitalisation in the reporting facility |
58 |
2.8% |
437 |
21.2% |
|
1b |
Healthcare-associated with a previous hospitalisation in the reporting facility |
7 |
0.3% |
70 |
3.4% |
|
1c |
Healthcare-associated with ambulatory care in the reporting facility |
22 |
1.1% |
183 |
8.9% |
|
1d |
Healthcare-associated with long term care unit in the reporting facility |
4 |
0.2% |
12 |
0.6% |
|
2 |
Healthcare-associated with another facility |
20 |
1.0% |
84 |
4.1% |
|
3 |
Community-associated |
117 |
5.7% |
1,085 |
52.6% |
|
4 |
Unknown origin |
30 |
1.4% |
193 |
9.4% |
|
Total |
|
258 |
12.5% |
2,064 |
100.0% |
* Percentage compared to total S. aureus.
Catheter-related primary bloodstream infection represented the most frequently reported type of infection (24.1%). In 2015-2016, primary bloodstream infection represented 51.7% of the overall HA-MRSA-BSI (cat. 1a, 1b and 1c) (Figure 3 and Table 5). Type of infections having more often leads to secondary bloodstream infections are pulmonary (13.8%), urinary (9.2%) and surgical site (9.2%) infections (Figure 3 and Table 5).
There are about as many primary bloodstream infections in teaching as in non-teaching facilities. Almost all surgical site infections occurred in teaching facilities. The majority of secondary urinary bloodstream infections occurred in non-teaching facilities with 110 beds and more (Table 5).
A total of 23 deaths were observed among the 87 HA-MRSA-BSI, yielding a 30 days case fatality of 26.4% (Table 6). This proportion is not significantly different from the one observed of HA-MSSA-BSI (18.7%).Figure 3 – Breakdown of Healthcare-Associated MRSA and MSSA Bloodstream Infections (cat. 1a. 1b and 1c) by Type of Infection. Québec, 2015-2016 (MRSA: N = 87; MSSA: N = 603)
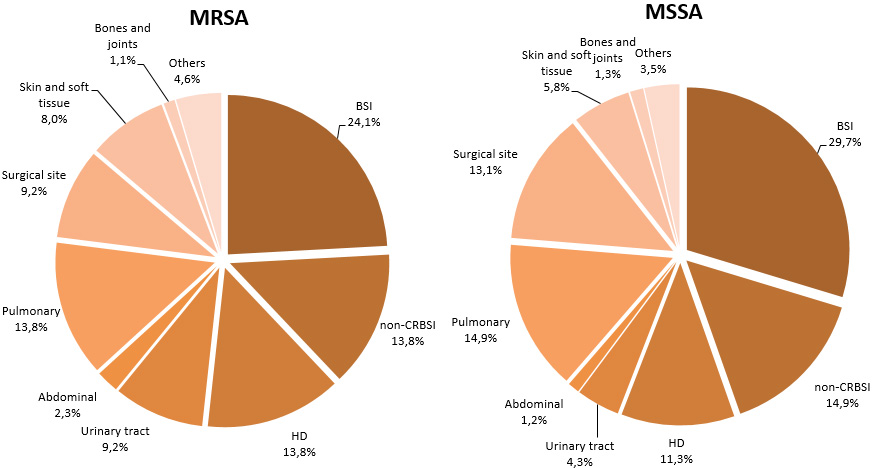
BSI : bloodstream infection
Non-CRBSI : non-catheter-related primary bloodstream infection
HD: hemodialysis
Table 5 – Number of cases Corresponding to Each type of Infection Associated with Healthcare-Associated MRSA Bloodstream Infections (cat. 1a. 1b and 1c) by Type of Facility. Québec, 2015-2016 (N = 87)
|
|
Primary BSI |
Secondary BSI |
|
|||||||||
|---|---|---|---|---|---|---|---|---|---|---|---|---|
|
Facilities |
CRBSI |
Non-CRBSI |
HD |
Urinary tract |
Abdominal |
Pulmonary |
Surgical site |
Skin and soft tissue |
Bones and joints |
Central nervous system |
Others |
Total |
|
Non-teaching facilities |
||||||||||||
|
< 110 beds |
2 |
4 |
1 |
0 |
0 |
2 |
0 |
1 |
0 |
0 |
2 |
12 |
|
≥ 110 beds |
8 |
3 |
4 |
6 |
1 |
4 |
1 |
2 |
0 |
0 |
2 |
31 |
|
Teaching facilities |
11 |
5 |
7 |
2 |
1 |
6 |
7 |
4 |
1 |
0 |
0 |
44 |
|
Pediatric facilitites |
0 |
0 |
0 |
0 |
0 |
0 |
0 |
0 |
0 |
0 |
0 |
0 |
|
Total |
21 |
12 |
12 |
8 |
2 |
12 |
8 |
7 |
1 |
0 |
4 |
87 |
BSI : bloodstream infection.
CRBSI : catheter-related bloodstream infection.
Non-CRBSI : non-catheter-related primary bloodstream infection.
HD: hemodialysis.
Table 6 – Number of Deaths and 30-days Case Fatality Related to Healthcare-Associated MRSA and MSSA Bloodstream Infections (cat. 1a. 1b and 1c), Québec, 2013-2014 to 2015-2016
|
|
2013-2014 |
2014-2015 |
2015-2016 |
|
|---|---|---|---|---|
|
MRSA |
Healthcare-associated bloodstream infections (N) |
132 |
133 |
87 |
|
Number of deaths (N) |
39 |
33 |
23 |
|
|
Case fatality (%) |
29.5 |
24.8 |
26.4 |
|
|
MSSA |
Healthcare-associated bloodstream infections (N) |
620 |
614 |
603 |
|
Number of deaths (N) |
143 |
174 |
113 |
|
|
|
Case fatality (%) |
23.1 |
28.3 |
18.7 |
Microbiology
The proportion of methicillin resistance in healthcare-associated bloodstream infections due to S. aureus decreased gradually from 2010-2011 to reach 12.6% 2015-2016 (Figure 4)
Figure 4 – Proportion of Methicillin Resistance in Healthcare-Associated Bloodstream Infections (cat. 1a, 1b and 1c) and all Bloodstream Infections (cat. 1a, 1b, 1c, 1d, 2, 3 and 4), Québec, 2010-2011 to 2014-2015 (N = 86)
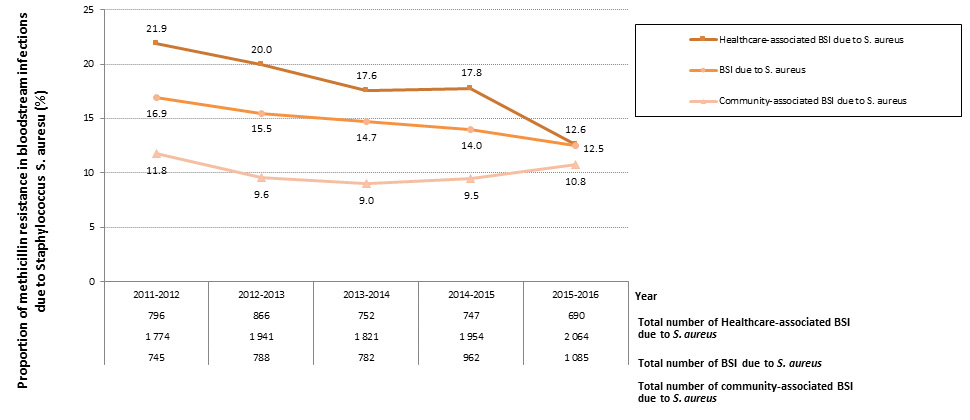
BSI: Bloodstream infections
Data per Healthcare Facility
The incidence rate of HA-MRSA-BSI and percentile ranking by type of facility are shown in Figures 5 through 8.
Figure 5 – Incidence Rate and Percentile Ranking of Healthcare-associated MRSA Bloodstream Infections (cat. 1a and 1b) by Facility for non-Teaching Healthcare Facilities with Less than 110 Beds, Québec, 2015-2016
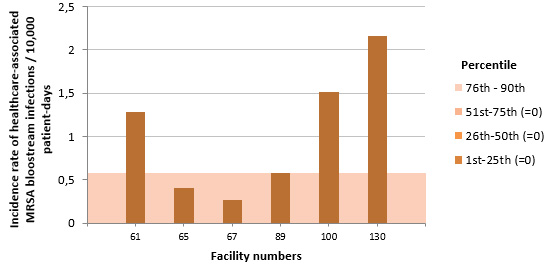
NB: Facilities 49, 51, 52, 53, 56, 59, 64, 70, 71, 74, 75, 77, 81, 82, 84, 85, 86, 91, 95, 96, 97, 99, 103, 107, 109 and 111 did not report any cases in 2015-2016.
Figure 6 – Incidence Rate and Percentile Ranking of Healthcare-associated MRSA Bloodstream Infections (cat. 1a and 1b) by Facility for non-Teaching Healthcare Facilities with 110 or more Beds, Québec, 2015-2016
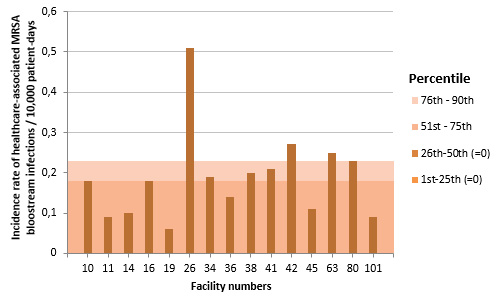
NB: Facilities 9, 23, 32, 35, 37, 39, 40, 44, 46, 47, 58, 72, 83, 88, 112 and 113 did not report any cases in 2015-2016.
Figure 7 – Incidence Rate and Percentile Ranking of Healthcare-associated MRSA Bloodstream Infections (cat. 1a and 1b) by Facility for Teaching Healthcare Facilities, Québec, 2015-2016
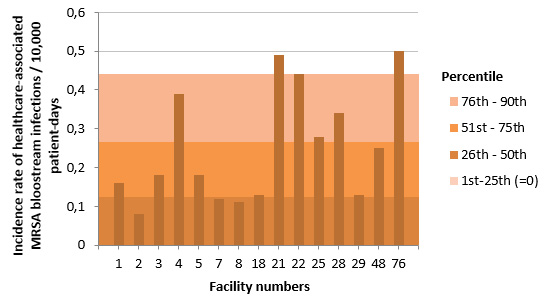
NB: Facilities 13, 15, 20, 24, 27, 30, 31, 33 and 118 did not report any cases in 2015-2016.
Figure 8 – Incidence Rate and Percentile Ranking of Healthcare-associated MRSA Bloodstream Infections (cat. 1a and 1b) by Facility for Pediatric Healthcare Facilities, Québec, 2015-2016
NB: Facilities 6 and 12 did not report any cases in 2015-2016.
At the local level, in 2015-2016, the incidence rate of HA-MRSA-BSI ranged from 0 to 2.16 per 10,000 patient-days. The incidence rate for the past five years of surveillance is shown in Table 7.
Overall, 8 facilities (9.0%) exhibited a significant decrease in the incidence rate of HA-MRSA-BSI per 10,000 patient-days compared to the 2014-2015 surveillance year, whereas 3 facilities (3.4%) exhibited a significant increase in this incidence rate. Furthermore, in 2015-2016, the incidence rate of HA-MRSA-BSI per 10,000 patient-days in health region of Estrie and Outaouais significantly decreased as compared to 2013-2014 whereas it significantly increased in the health region of Chaudière-Appalaches as compared in 2014-2015.
Table 8 presents the number of healthcare-associated MRSA bloodstream infections and the proportion of methicillin resistance in healthcare-associated S. aureus bloodstream infections for the past five years.
Table 7 – Incidence rate of Healthcare-associated MRSA Bloodstream Infections (cat. 1a and 1b) by Facility, Québec, 2011-2012 to 2015-2016 (Incidence Rate per 10.000 Patient-Days [95% CI])
|
RSS |
Facility |
|
Incidence rate of healthcare-associated MRSA bloodstream infections per 10,000 patient-days [I.C. 95%] |
||||
|---|---|---|---|---|---|---|---|
|
Number |
Name |
2011-2012 |
2012-2013 |
2013-2014 |
2014-2015 |
2015-2016 |
|
|
1 |
16 |
HOPITAL REGIONAL DE RIMOUSKI |
0.19 [0 ; 0.74] |
0 |
0 |
0.19 [0 ; 0.75] |
0.18 [0 ; 0.71] |
|
32 |
CENTRE HOSPITALIER REGIONAL DU GRAND-PORTAGE |
0.31 [0 ; 1.22] |
0.32 [0 ; 1.25] |
0 |
0 |
0 |
|
|
61 |
HOPITAL NOTRE-DAME-DE-FATIMA |
1.02 [0 ; 4.01] |
0 |
0 |
0 |
1.28 [0 ; 5.02] |
|
|
71 |
HOPITAL DE MATANE |
0 |
0 |
0 |
0 |
0 |
|
|
77 |
HOPITAL D'AMQUI |
0 |
0 |
0 |
0 |
0 |
|
|
84 |
HOPITAL DE NOTRE-DAME-DU-LAC |
0 |
0 |
0 |
0 |
0 |
|
|
|
|
BAS-SAINT-LAURENT |
0.24 [0.05 ; 0.59] |
0.08 [0 ; 0.31] |
0 |
0.08 [0 ; 0.32] |
0.17 [0.02 ; 0.48] |
|
2 |
20 |
HOPITAL DE CHICOUTIMI |
0 |
0.22 [0.02 ; 0.63] |
0 |
0.12 [0 ; 0.47] |
0 |
|
67 |
HOPITAL ET CENTRE DE READAPTATION DE JONQUIERE |
0 |
0.25 [0 ; 0.98] |
0 |
0 |
0.27 [0 ; 1.06] |
|
|
74 |
HOPITAL DE DOLBEAU-MISTASSINI |
0 |
0 |
0 |
0 |
0 |
|
|
88 |
HOPITAL. CLSC ET CENTRE D'HEBERGEMENT DE ROBERVAL |
0 |
0 |
0 |
0 |
0 |
|
|
100 |
HOPITAL DE LA BAIE |
- |
- |
- |
0 |
1.51 [0.14 ; 4.33]¥ |
|
|
112 |
HOPITAL D'ALMA |
0 |
0 |
0 |
0 |
0 |
|
|
|
|
SAGUENAY–LAC-SAINT-JEAN |
0 |
0.14 [0.03 ; 0.34] |
0 |
0.05 [0 ; 0.19] |
0.15 [0.03 ; 0.37] |
|
3 |
2 |
HOPITAL DE L'ENFANT-JESUS |
0.36 [0.11 ; 0.75] |
0.07 [0 ; 0.28] |
0.44 [0.16 ; 0.86] |
0.08 [0 ; 0.31] |
0.08 [0 ; 0.31] |
|
7 |
PAVILLON L'HOTEL-DIEU DE QUEBEC |
0.12 [0 ; 0.47] |
0.47 [0.12 ; 1.04] |
0.23 [0.02 ; 0.66] |
0.72 [0.26 ; 1.41] |
0.12 [0 ; 0.46]¥ |
|
|
24 |
HOPITAL DU SAINT-SACREMENT |
0 |
0.17 [0 ; 0.68] |
0 |
0 |
0 |
|
|
27 |
PAVILLON CENTRE HOSPITALIER DE L'UNIVERSITE LAVAL |
0.17 [0.02 ; 0.48] |
0 |
0 |
0 |
0 |
|
|
28 |
PAVILLON SAINT-FRANCOIS D'ASSISE |
0.11 [0 ; 0.43] |
0.67 [0.24 ; 1.31] |
0.22 [0.02 ; 0.63] |
0.11 [0 ; 0.43] |
0.34 [0.06 ; 0.83] |
|
|
33 |
INSTITUT UNIV. DE CARDIOL. ET DE PNEUMO. DE QUEBEC |
0.31 [0.06 ; 0.76] |
0.20 [0.02 ; 0.58] |
0 |
0 |
0 |
|
|
59 |
HOPITAL DE BAIE-SAINT-PAUL |
- |
- |
- |
0 |
0 |
|
|
86 |
HOPITAL DE LA MALBAIE |
0 |
0 |
0 |
0 |
0 |
|
|
|
|
CAPITALE-NATIONALE |
0.20 [0.10 ; 0.33] |
0.23 [0.12 ; 0.37] |
0.17 [0.08 ; 0.29] |
0.13 [0.05 ; 0.24] |
0.08 [0.02 ; 0.17] |
|
4 |
23 |
HOTEL-DIEU D'ARTHABASKA |
0 |
0.18 [0 ; 0.71] |
0 |
0 |
0 |
|
31 |
PAVILLON SAINTE-MARIE |
0.08 [0 ; 0.32] |
0.16 [0.02 ; 0.45] |
0 |
0 |
0 |
|
|
41 |
HOPITAL DU CENTRE-DE-LA-MAURICIE |
0 |
0 |
0 |
0.21 [0 ; 0.82] |
0.21 [0 ; 0.83] |
|
|
44 |
HOPITAL SAINTE-CROIX |
0.17 [0 ; 0.66] |
0.34 [0.03 ; 0.97] |
0.51 [0.10 ; 1.25] |
- |
0 |
|
|
85 |
CSSS DU HAUT-SAINT-MAURICE |
0 |
0 |
0 |
0 |
0 |
|
|
|
|
MAURICIE ET CENTRE-DU-QUÉBEC |
0.07 [0.01 ; 0.20] |
0.17 [0.05 ; 0.35] |
0.10 [0.02 ; 0.25] |
0.04 [0 ; 0.16] |
0.03 [0 ; 0.13] |
|
5 |
15 |
HOPITAL FLEURIMONT |
0.08 [0 ; 0.32] |
0.17 [0.02 ; 0.49] |
0.18 [0.02 ; 0.52] |
0.19 [0.02 ; 0.54] |
0¥ |
|
30 |
HOTEL-DIEU DE SHERBROOKE |
0.14 [0 ; 0.56] |
0.14 [0 ; 0.56] |
0.15 [0 ; 0.59] |
0.15 [0 ; 0.58] |
0 |
|
|
46 |
HOPITAL DE GRANBY |
0.46 [0.04 ; 1.32] |
0.94 [0.24 ; 2.09] |
0 |
0 |
0 |
|
|
49 |
CSSS DE MEMPHREMAGOG |
0 |
0 |
0 |
0 |
0 |
|
|
75 |
CSSS DU GRANIT |
0 |
0 |
0 |
1.30 [0 ; 5.09] |
0¥ |
|
|
99 |
HOPITAL BROME-MISSISQUOI-PERKINS |
0 |
0 |
0 |
0.36 [0 ; 1.41] |
0¥ |
|
|
|
|
ESTRIE |
0.14 [0.04 ; 0.31] |
0.25 [0.10 ; 0.47] |
0.11 [0.02 ; 0.27] |
0.18 [0.06 ; 0.37] |
0¥ |
|
6 |
3 |
GLEN - ROYAL VICTORIA |
0.24 [0.04 ; 0.59] |
0.34 [0.09 ; 0.75] |
0.53 [0.19 ; 1.04] |
0.18 [0.02 ; 0.52] |
0.18 [0.02 ; 0.52] |
|
4 |
HOPITAL NOTRE-DAME DU CHUM |
1.01 [0.52 ; 1.66] |
0.43 [0.14 ; 0.89] |
0.50 [0.18 ; 0.98] |
0.18 [0.02 ; 0.51] |
0.39 [0.10 ; 0.87] |
|
|
5 |
HOPITAL GENERAL JUIF |
0.39 [0.15 ; 0.73] |
0.29 [0.09 ; 0.60] |
0.23 [0.06 ; 0.51] |
0.35 [0.13 ; 0.68] |
0.18 [0.03 ; 0.44] |
|
|
6 |
GLEN - ENFANTS |
0 |
1.10 [0.29 ; 2.44] |
0 |
0 |
0 |
|
|
8 |
PAV. MAISONNEUVE/PAV. MARCEL-LAMOUREUX |
0.22 [0.06 ; 0.49] |
0.11 [0.01 ; 0.31] |
0.11 [0.01 ; 0.31] |
0.76 [0.41 ; 1.21] |
0.11 [0.01 ; 0.31]¥ |
|
|
12 |
CHU SAINTE-JUSTINE |
0 |
0 |
0 |
0.11 [0 ; 0.43] |
0 |
|
|
13 |
INSTITUT DE CARDIOLOGIE DE MONTREAL |
0 |
0.24 [0 ; 0.94] |
0.23 [0 ; 0.91] |
0 |
0 |
|
|
21 |
HOPITAL SAINT-LUC DU CHUM |
0.52 [0.17 ; 1.07] |
0.50 [0.16 ; 1.03] |
- |
0.29 [0.05 ; 0.72] |
0.49 [0.15 ; 1.02] |
|
|
22 |
HOTEL-DIEU DU CHUM |
0.76 [0.27 ; 1.49] |
1.12 [0.51 ; 1.97] |
0.64 [0.20 ; 1.32] |
0.81 [0.29 ; 1.59] |
0.44 [0.08 ; 1.08] |
|
|
25 |
HOPITAL DU SACRE-COEUR DE MONTREAL |
0.76 [0.39 ; 1.25] |
0.52 [0.22 ; 0.94] |
0.20 [0.04 ; 0.49] |
0.21 [0.04 ; 0.51] |
0.28 [0.07 ; 0.62] |
|
|
26 |
HOPITAL DE VERDUN |
0.79 [0.29 ; 1.55] |
0.27 [0.03 ; 0.77] |
0.28 [0.03 ; 0.80] |
0.14 [0 ; 0.54] |
0.51 [0.13 ; 1.13] |
|
|
29 |
HOPITAL GENERAL DE MONTREAL |
0.73 [0.31 ; 1.32] |
0.77 [0.33 ; 1.40] |
2.24 [1.37 ; 3.33] |
0.35 [0.07 ; 0.86] |
0.13 [0 ; 0.51] |
|
|
34 |
HOPITAL SANTA CABRINI |
0.30 [0.06 ; 0.73] |
0.66 [0.26 ; 1.24] |
0.19 [0.02 ; 0.54] |
0.19 [0.02 ; 0.55] |
0.19 [0.02 ; 0.54] |
|
|
36 |
HOPITAL GENERAL DU LAKESHORE |
0.61 [0.16 ; 1.35] |
0.72 [0.23 ; 1.49] |
0.29 [0.03 ; 0.84] |
0.29 [0.03 ; 0.83] |
0.14 [0 ; 0.54] |
|
|
38 |
HOPITAL JEAN-TALON |
0.18 [0 ; 0.70] |
0.57 [0.11 ; 1.39] |
0.39 [0.04 ; 1.11] |
0.19 [0 ; 0.75] |
0.20 [0 ; 0.78] |
|
|
48 |
CENTRE HOSPITALIER DE ST. MARY |
0.25 [0.02 ; 0.72] |
1.12 [0.51 ; 1.97] |
0 |
0.62 [0.19 ; 1.29] |
0.25 [0.02 ; 0.72] |
|
|
76 |
HOPITAL DE LACHINE |
0 |
0 |
1.03 [0.10 ; 2.95] |
1.70 [0.32 ; 4.17] |
0.50 [0 ; 1.97] |
|
|
80 |
HOPITAL FLEURY |
0.46 [0.04 ; 1.32] |
0.23 [0 ; 0.90] |
0.46 [0.04 ; 1.32] |
0 |
0.23 [0 ; 0.90] |
|
|
83 |
HOPITAL DE LASALLE |
0.83 [0.08 ; 2.38] |
0.83 [0.08 ; 2.38] |
0 |
0 |
0 |
|
|
116 |
INSTITUT THORACIQUE DE MONTREAL |
0.45 [0 ; 1.76] |
0.45 [0 ; 1.76] |
0 |
0 |
- |
|
|
118 |
HOPITAL NEUROLOGIQUE DE MONTREAL |
0 |
0 |
0 |
0 |
0 |
|
|
|
|
MONTRÉAL |
0.45 [0.36 ; 0.56] |
0.47 [0.37 ; 0.58] |
0.37 [0.28 ; 0.47] |
0.33 [0.25 ; 0.42] |
0.22 [0.15 ; 0.30] |
|
7 |
39 |
HOPITAL DE GATINEAU |
0 |
0 |
0 |
0.33 [0.03 ; 0.95] |
0¥ |
|
40 |
HOPITAL DE HULL |
0 |
0 |
0.16 [0 ; 0.62] |
0.15 [0 ; 0.60] |
0 |
|
|
51 |
HOPITAL DE MANIWAKI |
0.68 [0 ; 2.67] |
0 |
0 |
0 |
0 |
|
|
95 |
HOPITAL DU PONTIAC |
0 |
0.72 [0 ; 2.82] |
0 |
0.81 [0 ; 3.18] |
0 |
|
|
111 |
HOPITAL DE PAPINEAU |
0 |
0 |
0 |
0 |
0 |
|
|
|
|
OUTAOUAIS |
0.05 [0 ; 0.20] |
0.05 [0 ; 0.21] |
0.06 [0 ; 0.23] |
0.23 [0.06 ; 0.51] |
0¥ |
|
8 |
47 |
HOPITAL DE ROUYN-NORANDA |
0 |
0 |
1.29 [0.24 ; 3.16] |
0.40 [0 ; 1.56] |
0 |
|
52 |
HOPITAL D'AMOS |
0.40 [0 ; 1.57] |
0 |
0 |
0 |
0 |
|
|
65 |
HOPITAL ET CLSC DE VAL-D'OR |
0 |
0 |
0.34 [0 ; 1.33] |
0.35 [0 ; 1.38] |
0.41 [0 ; 1.61] |
|
|
70 |
CENTRE DE SOINS DE COURTE DUREE LA SARRE (CSCD) |
0 |
0 |
0 |
0 |
0 |
|
|
82 |
PAVILLON SAINTE-FAMILLE |
0 |
2.69 [0.25 ; 7.71] |
0 |
0 |
0 |
|
|
|
|
ABITIBI-TÉMISCAMINGUE |
0.10 [0 ; 0.40] |
0.21 [0.02 ; 0.60] |
0.43 [0.11 ; 0.96] |
0.21 [0.02 ; 0.61] |
0.11 [0 ; 0.43] |
|
9 |
64 |
HOPITAL LE ROYER |
0 |
0.72 [0.07 ; 2.06] |
0 |
0 |
0 |
|
72 |
HOPITAL ET CENTRE D'HEBERGEMENT DE SEPT-ILES |
0 |
0] |
0.41 [0 ; 1.61] |
0 |
0 |
|
|
|
|
CÔTE-NORD |
0 |
0.40 [0.04 ; 1.15] |
0.20 [0 ; 0.78] |
0 |
0 |
|
10 |
96 |
CENTRE DE SANTE DE CHIBOUGAMAU |
0 |
0 |
0 |
0 |
0 |
|
|
|
NORD-DU-QUÉBEC |
0 |
0 |
0 |
0 |
0 |
|
11 |
53 |
HOPITAL DE CHANDLER |
0.67 [0 ; 2.63] |
0 |
0 |
0 |
0 |
|
91 |
HOPITAL HOTEL-DIEU DE GASPE |
0 |
0.97 [0 ; 3.80] |
0.96 [0 ; 3.77] |
1.00 [0 ; 3.93] |
0 |
|
|
97 |
HOPITAL DE MARIA |
0 |
0 |
0 |
0 |
0 |
|
|
107 |
HOPITAL DE L'ARCHIPEL |
0 |
0 |
0 |
0 |
0 |
|
|
109 |
HOPITAL DE SAINTE-ANNE-DES-MONTS |
0 |
0 |
0 |
0 |
0 |
|
|
|
|
GASPÉSIE-ÎLES-DE-LA-MADELEINE |
0.16 [0 ; 0.62] |
0.17 [0 ; 0.66] |
0.17 [0 ; 0.67] |
0.17 [0 ; 0.66] |
0 |
|
12 |
18 |
HOTEL-DIEU DE LEVIS |
0.37 [0.07 ; 0.91] |
0.13 [0 ; 0.50] |
0.13 [0 ; 0.51] |
0 |
0.13 [0 ; 0.52] |
|
63 |
HOPITAL DE SAINT-GEORGES |
0.21 [0 ; 0.83] |
0 |
0 |
0 |
0.25 [0 ; 0.99] |
|
|
89 |
HOPITAL DE MONTMAGNY |
0.87 [0.08 ; 2.49] |
0.47 [0 ; 1.85] |
0.54 [0 ; 2.12] |
0 |
0.58 [0 ; 2.27] |
|
|
113 |
HOPITAL DE THETFORD MINES |
0.75 [0.07 ; 2.15] |
1.09 [0.20 ; 2.67] |
0.40 [0 ; 1.56] |
0 |
0 |
|
|
|
|
CHAUDIÈRE-APPALACHES |
0.45 [0.19 ; 0.82] |
0.29 [0.09 ; 0.60] |
0.19 [0.04 ; 0.46] |
0 |
0.19 [0.03 ; 0.47]¥ |
|
13 |
19 |
HOPITAL CITE DE LA SANTE |
0.06 [0 ; 0.24] |
0.52 [0.24 ; 0.92] |
0.35 [0.13 ; 0.69] |
0.17 [0.03 ; 0.42] |
0.06 [0 ; 0.23] |
|
|
|
LAVAL |
0.06 [0 ; 0.24] |
0.52 [0.24 ; 0.92] |
0.35 [0.13 ; 0.69] |
0.17 [0.03 ; 0.42] |
0.06 [0 ; 0.23] |
|
14 |
11 |
HOPITAL PIERRE-LE GARDEUR |
0.20 [0.02 ; 0.58] |
0 |
0.19 [0.02 ; 0.54] |
0.18 [0.02 ; 0.52] |
0.09 [0 ; 0.35] |
|
14 |
CENTRE HOSPITALIER REGIONAL DE LANAUDIERE |
0.23 [0.02 ; 0.66] |
0.34 [0.06 ; 0.84] |
0.23 [0.02 ; 0.66] |
0.21 [0.02 ; 0.60] |
0.10 [0 ; 0.40] |
|
|
|
|
LANAUDIÈRE |
0.21 [0.05 ; 0.47] |
0.16 [0.03 ; 0.39] |
0.21 [0.06 ; 0.46] |
0.19 [0.05 ; 0.43] |
0.10 [0.01 ; 0.28] |
|
15 |
45 |
HOPITAL DE SAINT-EUSTACHE |
0 |
0.12 [0 ; 0.47] |
0 |
0.33 [0.06 ; 0.81] |
0.11 [0 ; 0.44] |
|
56 |
CSSS D'ARGENTEUIL |
1.32 [0.13 ; 3.78] |
0 |
0.71 [0 ; 2.79] |
0 |
0 |
|
|
81 |
HOPITAL DE MONT-LAURIER |
0 |
0 |
0 |
0 |
0 |
|
|
101 |
HOPITAL REGIONAL DE SAINT-JEROME |
1.00 [0.48 ; 1.72] |
0.29 [0.06 ; 0.71] |
0.19 [0.02 ; 0.54] |
0.35 [0.09 ; 0.78] |
0.09 [0 ; 0.35] |
|
|
103 |
HOPITAL LAURENTIEN |
0 |
0 |
0 |
0 |
0 |
|
|
|
|
LAURENTIDES |
0.51 [0.26 ; 0.84] |
0.16 [0.04 ; 0.36] |
0.12 [0.02 ; 0.29] |
0.27 [0.11 ; 0.51] |
0.08 [0.01 ; 0.23] |
|
16 |
1 |
HOPITAL CHARLES LEMOYNE |
0.56 [0.22 ; 1.05] |
0 |
0.24 [0.05 ; 0.59] |
0 |
0.16 [0.02 ; 0.45]¥ |
|
9 |
HOPITAL DU HAUT-RICHELIEU |
0.12 [0 ; 0.47] |
0.43 [0.11 ; 0.96] |
0.22 [0.02 ; 0.63] |
0.12 [0 ; 0.46] |
0 |
|
|
10 |
HOPITAL PIERRE-BOUCHER |
0.20 [0.02 ; 0.57] |
0 |
0.19 [0.02 ; 0.55] |
0.19 [0.02 ; 0.54] |
0.18 [0.02 ; 0.52] |
|
|
35 |
HOPITAL HONORE-MERCIER |
0.15 [0 ; 0.59] |
0.44 [0.08 ; 1.08] |
0 |
0.58 [0.15 ; 1.29] |
0¥ |
|
|
37 |
HOTEL-DIEU DE SOREL |
0.39 [0.04 ; 1.12] |
0.20 [0 ; 0.78] |
0 |
0.21 [0 ; 0.82] |
0 |
|
|
42 |
CENTRE HOSPITALIER ANNA-LABERGE |
0.28 [0.03 ; 0.80] |
0.13 [0 ; 0.51] |
0.39 [0.07 ; 0.95] |
0.54 [0.14 ; 1.20] |
0.27 [0.03 ; 0.77] |
|
|
58 |
HOPITAL DU SUROIT |
0.34 [0.03 ; 0.98] |
0 |
0.16 [0 ; 0.62] |
0.53 [0.10 ; 1.30] |
0¥ |
|
|
130 |
HOPITAL BARRIE MEMORIAL |
0 |
0 |
0 |
0 |
2.16 [0.41 ; 5.30]¥ |
|
|
|
|
MONTÉRÉGIE |
0.30 [0.17 ; 0.46] |
0.15 [0.07 ; 0.26] |
0.19 [0.10 ; 0.32] |
0.26 [0.15 ; 0.41] |
0.16 [0.07 ; 0.28] |
|
|
|
Total |
0.29 [0.24 ; 0.34] |
0.29 [0.24 ; 0.34] |
0.23 [0.19 ; 0.27] |
0.22 [0.18 ; 0.26] |
0.13 [0.10 ; 0.16]¥ |
HR: Heath region.
¥ Significant statistical difference (p < 0.05) between healthcare-associated MRSA bloodstream infections of 2014-2015 and 2015-2016.
When the incidence rate is 0, the confidence interval [CI] is not calculated.
- Facilities that did not participated to the surveillance or that participated to less than 11 periods.
Table 8 – Number of Healthcare-associated MRSA Bloodstream Infections and Proportion of Resistance to Methicillin by Healthcare-Associated S. aureus Bloodstream Infection (cat. 1a and 1b) by Facility, Québec, 2011-2012 to 2015-2016 (Number, [%])
|
RSS |
Facility |
|
Number of healthcare-associated MRSA bloodstream infections and proportion of resistance to methicillin by healthcare-associated S. aureus bloodstream infections (N [%]) |
||||
|---|---|---|---|---|---|---|---|
|
Number |
Name |
2011-2012 |
2012-2013 |
2013-2014 |
2014-2015 |
2015-2016 |
|
|
1 |
16 |
HOPITAL REGIONAL DE RIMOUSKI |
1/6 (16.7%) |
0/6 (0%) |
0/7 (0%) |
1/4 (25%) |
1/7 (14.3%) |
|
32 |
CENTRE HOSPITALIER REGIONAL DU GRAND-PORTAGE |
1/6 (16.7%) |
1/2 (50%) |
0/2 (0%) |
0/1 (0%) |
0/2 (0%) |
|
|
61 |
HOPITAL NOTRE-DAME-DE-FATIMA |
1/1 (100%) |
0/0 (0%) |
0/0 (0%) |
0/0 (0%) |
1/2 (50%) |
|
|
71 |
HOPITAL DE MATANE |
0/0 (0%) |
0/0 (0%) |
0/0 (0%) |
0/0 (0%) |
0/0 (0%) |
|
|
77 |
HOPITAL D'AMQUI |
0/0 (0%) |
0/0 (0%) |
0/0 (0%) |
0/0 (0%) |
0/0 (0%) |
|
|
84 |
HOPITAL DE NOTRE-DAME-DU-LAC |
0/0 (0%) |
0/0 (0%) |
0/1 (0%) |
0/0 (0%) |
0/0 (0%) |
|
|
|
|
BAS-SAINT-LAURENT |
3/13 (23.1%) |
1/8 (12.5%) |
0/10 (0%) |
1/5 (20%) |
2/11 (18.2%) |
|
2 |
20 |
HOPITAL DE CHICOUTIMI |
1/4 (25%) |
2/18 (11.1%) |
0/32 (0%) |
1/12 (8.3%) |
0/8 (0%) |
|
67 |
HOPITAL ET CENTRE DE READAPTATION DE JONQUIERE |
0/4 (0%) |
1/1 (100%) |
0/1 (0%) |
0/2 (0%) |
1/4 (25%) |
|
|
74 |
HOPITAL DE DOLBEAU-MISTASSINI |
0/1 (0%) |
0/1 (0%) |
0/2 (0%) |
1/2 (50%) |
0/1 (0%) |
|
|
88 |
HOPITAL. CLSC ET CENTRE D'HEBERGEMENT DE ROBERVAL |
0/2 (0%) |
0/2 (0%) |
0/2 (0%) |
1/3 (33.3%) |
0/2 (0%) |
|
|
100 |
HOPITAL DE LA BAIE |
- |
- |
- |
0/0 (0%) |
2/2 (100%) |
|
|
112 |
HOPITAL D'ALMA |
0/6 (0%) |
0/0 (0%) |
0/0 (0%) |
0/2 (0%) |
0/2 (0%) |
|
|
|
|
SAGUENAY‒LAC-SAINT-JEAN |
1/17 (5.9%) |
3/22 (13.6%) |
0/37 (0%) |
3/21 (14.3%) |
3/19 (15.8%) |
|
3 |
2 |
HOPITAL DE L'ENFANT-JESUS |
5/29 (17.2%) |
1/31 (3.2%) |
6/23 (26.1%) |
1/17 (5.9%) |
1/20 (5%) |
|
7 |
PAVILLON L'HOTEL-DIEU DE QUEBEC |
2/27 (7.4%) |
4/29 (13.8%) |
3/22 (13.6%) |
6/27 (22.2%) |
1/23 (4.3%) |
|
|
24 |
HOPITAL DU SAINT-SACREMENT |
0/1 (0%) |
1/4 (25%) |
0/2 (0%) |
0/2 (0%) |
0/3 (0%) |
|
|
27 |
PAVILLON CENTRE HOSPITALIER DE L'UNIVERSITE LAVAL |
2/9 (22.2%) |
0/6 (0%) |
0/10 (0%) |
0/6 (0%) |
0/5 (0%) |
|
|
28 |
PAVILLON SAINT-FRANCOIS D'ASSISE |
1/5 (20%) |
6/9 (66.7%) |
2/14 (14.3%) |
2/10 (20%) |
3/14 (21.4%) |
|
|
33 |
INSTITUT UNIV. DE CARDIOL. ET DE PNEUMO. DE QUEBEC |
3/9 (33.3%) |
2/8 (25%) |
0/10 (0%) |
0/8 (0%) |
0/8 (0%) |
|
|
59 |
HOPITAL DE BAIE-SAINT-PAUL |
- |
- |
- |
0/0 (0%) |
0/0 (0%) |
|
|
86 |
HOPITAL DE LA MALBAIE |
0/0 (0%) |
0/0 (0%) |
0/0 (0%) |
0/0 (0%) |
0/0 (0%) |
|
|
|
|
CAPITALE-NATIONALE |
13/80 (16.3%) |
14/87 (16.1%) |
11/81 (13.6%) |
9/70 (12.9%) |
5/73 (6.8%) |
|
4 |
23 |
HOTEL-DIEU D'ARTHABASKA |
0/6 (0%) |
1/2 (50%) |
0/4 (0%) |
0/2 (0%) |
0/3 (0%) |
|
31 |
PAVILLON SAINTE-MARIE |
1/16 (6.3%) |
2/13 (15.4%) |
0/17 (0%) |
1/15 (6.7%) |
1/17 (5.9%) |
|
|
41 |
HOPITAL DU CENTRE-DE-LA-MAURICIE |
0/3 (0%) |
0/1 (0%) |
0/1 (0%) |
1/5 (20%) |
1/4 (25%) |
|
|
44 |
HOPITAL SAINTE-CROIX |
1/6 (16.7%) |
2/5 (40%) |
3/6 (50%) |
- |
0/3 (0%) |
|
|
85 |
CSSS DU HAUT-SAINT-MAURICE |
0/0 (0%) |
0/0 (0%) |
0/0 (0%) |
0/0 (0%) |
0/0 (0%) |
|
|
|
|
MAURICIE ET CENTRE-DU-QUEBEC |
2/31 (6.5%) |
5/21 (23.8%) |
3/28 (10.7%) |
2/22 (9.1%) |
2/27 (7.4%) |
|
5 |
15 |
HOPITAL FLEURIMONT |
1/13 (7.7%) |
2/20 (10%) |
3/23 (13%) |
2/29 (6.9%) |
0/21 (0%) |
|
30 |
HOTEL-DIEU DE SHERBROOKE |
1/3 (33.3%) |
1/7 (14.3%) |
2/6 (33.3%) |
1/6 (16.7%) |
0/6 (0%) |
|
|
46 |
HOPITAL DE GRANBY |
3/6 (50%) |
4/12 (33.3%) |
0/3 (0%) |
0/3 (0%) |
0/7 (0%) |
|
|
49 |
CSSS DE MEMPHREMAGOG |
0/0 (0%) |
0/2 (0%) |
0/0 (0%) |
0/1 (0%) |
0/0 (0%) |
|
|
75 |
CSSS DU GRANIT |
0/0 (0%) |
0/0 (0%) |
0/1 (0%) |
1/2 (50%) |
0/0 (0%) |
|
|
99 |
HOPITAL BROME-MISSISQUOI-PERKINS |
0/2 (0%) |
0/1 (0%) |
0/0 (0%) |
2/10 (20%) |
0/1 (0%) |
|
|
|
|
ESTRIE |
5/24 (20.8%) |
7/42 (16.7%) |
5/33 (15.2%) |
6/51 (11.8%) |
0/35 (0%) |
|
6 |
3 |
GLEN - ROYAL VICTORIA |
5/25 (20%) |
8/36 (22.2%) |
8/34 (23.5%) |
3/21 (14.3%) |
2/21 (9.5%) |
|
4 |
HOPITAL NOTRE-DAME DU CHUM |
14/39 (35.9%) |
6/24 (25%) |
7/37 (18.9%) |
2/30 (6.7%) |
5/27 (18.5%) |
|
|
5 |
HOPITAL GENERAL JUIF |
8/26 (30.8%) |
5/29 (17.2%) |
7/30 (23.3%) |
8/40 (20%) |
3/25 (12%) |
|
|
6 |
GLEN - ENFANTS |
1/10 (10%) |
4/11 (36.4%) |
0/9 (0%) |
0/4 (0%) |
0/10 (0%) |
|
|
8 |
PAV. MAISONNEUVE/PAV. MARCEL-LAMOUREUX |
8/37 (21.6%) |
2/36 (5.6%) |
3/24 (12.5%) |
15/34 (44.1%) |
5/32 (15.6%) |
|
|
12 |
CHU SAINTE-JUSTINE |
0/14 (0%) |
0/14 (0%) |
0/19 (0%) |
1/8 (12.5%) |
0/10 (0%) |
|
|
13 |
INSTITUT DE CARDIOLOGIE DE MONTREAL |
0/4 (0%) |
1/4 (25%) |
1/8 (12.5%) |
0/9 (0%) |
0/7 (0%) |
|
|
21 |
HOPITAL SAINT-LUC DU CHUM |
5/33 (15.2%) |
6/26 (23.1%) |
- |
3/13 (23.1%) |
6/20 (30%) |
|
|
22 |
HOTEL-DIEU DU CHUM |
6/15 (40%) |
9/27 (33.3%) |
5/26 (19.2%) |
6/27 (22.2%) |
3/15 (20%) |
|
|
25 |
HOPITAL DU SACRE-COEUR DE MONTREAL |
16/52 (30.8%) |
10/60 (16.7%) |
4/26 (15.4%) |
5/41 (12.2%) |
6/40 (15%) |
|
|
26 |
HOPITAL DE VERDUN |
6/14 (42.9%) |
4/12 (33.3%) |
2/10 (20%) |
1/10 (10%) |
6/12 (50%) |
|
|
29 |
HOPITAL GENERAL DE MONTREAL |
11/30 (36.7%) |
10/36 (27.8%) |
21/40 (52.5%) |
8/39 (20.5%) |
1/20 (5%) |
|
|
34 |
HOPITAL SANTA CABRINI |
3/17 (17.6%) |
8/17 (47.1%) |
3/6 (50%) |
2/5 (40%) |
2/12 (16.7%) |
|
|
36 |
HOPITAL GENERAL DU LAKESHORE |
5/15 (33.3%) |
7/11 (63.6%) |
2/6 (33.3%) |
2/7 (28.6%) |
2/7 (28.6%) |
|
|
38 |
HOPITAL JEAN-TALON |
1/11 (9.1%) |
3/6 (50%) |
2/7 (28.6%) |
1/6 (16.7%) |
1/9 (11.1%) |
|
|
48 |
CENTRE HOSPITALIER DE ST. MARY |
2/11 (18.2%) |
10/28 (35.7%) |
0/8 (0%) |
5/21 (23.8%) |
2/11 (18.2%) |
|
|
76 |
HOPITAL DE LACHINE |
1/2 (50%) |
0/1 (0%) |
2/2 (100%) |
4/5 (80%) |
1/4 (25%) |
|
|
80 |
HOPITAL FLEURY |
2/11 (18.2%) |
1/4 (25%) |
2/6 (33.3%) |
0/2 (0%) |
1/6 (16.7%) |
|
|
83 |
HOPITAL DE LASALLE |
3/5 (60%) |
2/5 (40%) |
0/0 (0%) |
0/0 (0%) |
0/0 (0%) |
|
|
116 |
INSTITUT THORACIQUE DE MONTREAL |
1/1 (100%) |
1/1 (100%) |
0/0 (0%) |
0/0 (0%) |
- |
|
|
118 |
HOPITAL FLEURY |
2/11 (18.2%) |
1/4 (25%) |
2/6 (33.3%) |
0/2 (0%) |
1/6 (16.7%) |
|
|
|
|
MONTREAL |
98/372 (26.3%) |
97/389 (24.9%) |
69/298 (23.2%) |
66/325 (20.3%) |
46/290 (15.9%) |
|
7 |
39 |
HOPITAL DE GATINEAU |
0/5 (0%) |
0/3 (0%) |
0/3 (0%) |
2/5 (40%) |
1/8 (12.5%) |
|
40 |
HOPITAL DE HULL |
0/12 (0%) |
0/5 (0%) |
1/10 (10%) |
1/16 (6.3%) |
0/13 (0%) |
|
|
51 |
HOPITAL DE MANIWAKI |
1/3 (33.3%) |
0/1 (0%) |
0/1 (0%) |
1/2 (50%) |
0/0 (0%) |
|
|
95 |
HOPITAL DU PONTIAC |
0/0 (0%) |
1/1 (100%) |
1/1 (100%) |
1/1 (100%) |
0/0 (0%) |
|
|
111 |
HOPITAL DE PAPINEAU |
0/0 (0%) |
0/0 (0%) |
0/1 (0%) |
0/1 (0%) |
0/0 (0%) |
|
|
|
|
OUTAOUAIS |
1/20 (5%) |
1/10 (10%) |
2/16 (12.5%) |
5/25 (20%) |
1/21 (4.8%) |
|
8 |
47 |
HOPITAL DE ROUYN-NORANDA |
0/3 (0%) |
0/1 (0%) |
3/6 (50%) |
1/3 (33.3%) |
0/1 (0%) |
|
52 |
HOPITAL D'AMOS |
1/1 (100%) |
0/0 (0%) |
0/0 (0%) |
0/0 (0%) |
0/1 (0%) |
|
|
65 |
HOPITAL ET CLSC DE VAL-D'OR |
0/3 (0%) |
1/9 (11.1%) |
1/2 (50%) |
2/4 (50%) |
1/5 (20%) |
|
|
70 |
CENTRE DE SOINS DE COURTE DUREE LA SARRE (CSCD) |
0/1 (0%) |
0/0 (0%) |
0/0 (0%) |
0/0 (0%) |
0/0 (0%) |
|
|
82 |
PAVILLON SAINTE-FAMILLE |
0/0 (0%) |
2/3 (66.7%) |
0/0 (0%) |
0/1 (0%) |
0/1 (0%) |
|
|
|
|
ABITIBI-TEMISCAMINGUE |
1/8 (12.5%) |
3/13 (23.1%) |
4/8 (50%) |
3/8 (37.5%) |
1/8 (12.5%) |
|
9 |
64 |
HOPITAL LE ROYER |
0/4 (0%) |
2/3 (66.7%) |
0/3 (0%) |
1/2 (50%) |
0/2 (0%) |
|
72 |
HOPITAL ET CENTRE D'HEBERGEMENT DE SEPT-ILES |
0/0 (0%) |
0/3 (0%) |
1/1 (100%) |
0/1 (0%) |
0/1 (0%) |
|
|
|
|
CÔTE-NORD |
0/4 (0%) |
2/6 (33.3%) |
1/4 (25%) |
1/3 (33.3%) |
0/3 (0%) |
|
10 |
96 |
CENTRE DE SANTE DE CHIBOUGAMAU |
0/1 (0%) |
0/1 (0%) |
0/0 (0%) |
0/0 (0%) |
0/0 (0%) |
|
|
|
NORD-DU-QUEBEC |
0/1 (0%) |
0/1 (0%) |
0/0 (0%) |
0/0 (0%) |
0/0 (0%) |
|
11 |
53 |
HOPITAL DE CHANDLER |
1/2 (50%) |
0/0 (0%) |
0/4 (0%) |
0/0 (0%) |
0/1 (0%) |
|
91 |
HOPITAL HOTEL-DIEU DE GASPE |
0/0 (0%) |
1/2 (50%) |
1/2 (50%) |
1/1 (100%) |
0/3 (0%) |
|
|
97 |
HOPITAL DE MARIA |
0/0 (0%) |
0/0 (0%) |
0/2 (0%) |
0/1 (0%) |
1/1 (100%) |
|
|
107 |
HOPITAL DE L'ARCHIPEL |
0/0 (0%) |
0/1 (0%) |
0/0 (0%) |
0/0 (0%) |
0/0 (0%) |
|
|
109 |
HOPITAL DE SAINTE-ANNE-DES-MONTS |
0/1 (0%) |
0/0 (0%) |
0/1 (0%) |
0/0 (0%) |
0/0 (0%) |
|
|
|
|
GASPESIE‒ÎLES-DE-LA-MADELEINE |
1/3 (33.3%) |
1/3 (33.3%) |
1/9 (11.1%) |
1/2 (50%) |
1/5 (20%) |
|
18 |
HOTEL-DIEU DE LEVIS |
3/18 (16.7%) |
3/21 (14.3%) |
2/23 (8.7%) |
0/6 (0%) |
1/8 (12.5%) |
|
|
12 |
63 |
HOPITAL DE SAINT-GEORGES |
1/3 (33.3%) |
0/3 (0%) |
0/6 (0%) |
0/0 (0%) |
1/4 (25%) |
|
89 |
HOPITAL DE MONTMAGNY |
2/3 (66.7%) |
1/3 (33.3%) |
1/2 (50%) |
0/0 (0%) |
1/2 (50%) |
|
|
113 |
HOPITAL DE THETFORD MINES |
2/5 (40%) |
3/11 (27.3%) |
1/5 (20%) |
0/4 (0%) |
0/2 (0%) |
|
|
19 |
HOPITAL CITE DE LA SANTE |
3/31 (9.7%) |
11/57 (19.3%) |
7/41 (17.1%) |
5/34 (14.7%) |
3/29 (10.3%) |
|
|
|
|
CHAUDIÈRE-APPALACHES |
8/29 (27.6%) |
7/38 (18.4%) |
4/36 (11.1%) |
0/10 (0%) |
3/16 (18.8%) |
|
13 |
19 |
HOPITAL CITE DE LA SANTE |
3/31 (9.7%) |
11/57 (19.3%) |
7/41 (17.1%) |
5/34 (14.7%) |
3/29 (10.3%) |
|
|
|
LAVAL |
3/31 (9.7%) |
11/57 (19.3%) |
7/41 (17.1%) |
5/34 (14.7%) |
3/29 (10.3%) |
|
14 |
11 |
HOPITAL PIERRE-LE GARDEUR |
5/14 (35.7%) |
1/13 (7.7%) |
3/21 (14.3%) |
2/27 (7.4%) |
1/8 (12.5%) |
|
14 |
CENTRE HOSPITALIER REGIONAL DE LANAUDIERE |
2/11 (18.2%) |
5/19 (26.3%) |
3/17 (17.6%) |
2/19 (10.5%) |
1/18 (5.6%) |
|
|
|
|
LANAUDIÈRE |
7/25 (28%) |
6/32 (18.8%) |
6/38 (15.8%) |
4/46 (8.7%) |
2/26 (7.7%) |
|
15 |
45 |
HOPITAL DE SAINT-EUSTACHE |
0/4 (0%) |
1/6 (16.7%) |
0/8 (0%) |
3/12 (25%) |
1/6 (16.7%) |
|
56 |
CSSS D'ARGENTEUIL |
2/6 (33.3%) |
0/0 (0%) |
2/2 (100%) |
0/1 (0%) |
1/5 (20%) |
|
|
81 |
HOPITAL DE MONT-LAURIER |
0/0 (0%) |
0/3 (0%) |
0/1 (0%) |
0/1 (0%) |
1/3 (33.3%) |
|
|
101 |
HOPITAL REGIONAL DE SAINT-JEROME |
10/34 (29.4%) |
3/35 (8.6%) |
3/17 (17.6%) |
5/23 (21.7%) |
2/30 (6.7%) |
|
|
103 |
HOPITAL LAURENTIEN |
0/1 (0%) |
0/0 (0%) |
0/2 (0%) |
0/0 (0%) |
0/2 (0%) |
|
|
|
|
LAURENTIDES |
12/45 (26.7%) |
4/44 (9.1%) |
5/30 (16.7%) |
8/37 (21.6%) |
5/46 (10.9%) |
|
16 |
1 |
HOPITAL CHARLES LEMOYNE |
8/29 (27.6%) |
0/22 (0%) |
5/29 (17.2%) |
2/30 (6.7%) |
3/17 (17.6%) |
|
9 |
HOPITAL DU HAUT-RICHELIEU |
1/17 (5.9%) |
4/22 (18.2%) |
2/11 (18.2%) |
2/11 (18.2%) |
0/17 (0%) |
|
|
10 |
HOPITAL PIERRE-BOUCHER |
3/12 (25%) |
0/7 (0%) |
2/7 (28.6%) |
2/12 (16.7%) |
2/10 (20%) |
|
|
35 |
HOPITAL HONORE-MERCIER |
1/6 (16.7%) |
3/13 (23.1%) |
0/9 (0%) |
4/8 (50%) |
0/2 (0%) |
|
|
37 |
HOTEL-DIEU DE SOREL |
2/11 (18.2%) |
1/11 (9.1%) |
1/10 (10%) |
1/9 (11.1%) |
0/8 (0%) |
|
|
42 |
CENTRE HOSPITALIER ANNA-LABERGE |
2/8 (25%) |
2/10 (20%) |
3/11 (27.3%) |
4/8 (50%) |
3/7 (42.9%) |
|
|
58 |
HOPITAL DU SUROIT |
2/8 (25%) |
1/8 (12.5%) |
1/4 (25%) |
4/10 (40%) |
2/15 (13.3%) |
|
|
130 |
HOPITAL BARRIE MEMORIAL |
0/2 (0%) |
0/0 (0%) |
0/2 (0%) |
0/0 (0%) |
3/5 (60%) |
|
|
|
|
MONTÉRÉGIE |
19/93 (20.4%) |
11/93 (11.8%) |
14/83 (16.9%) |
19/88 (21.6%) |
13/81 (16%) |
|
|
|
Total |
174/796 (21.9%) |
173/866 (20%) |
132/752 (17.6%) |
133/747 (17.8%) |
87/690 (12.6%) |
HR: Heath region.
- Facilities that did not participated to the surveillance or that participated to less than 11 periods.
Author
Comité de surveillance provinciale des infections nosocomiales (SPIN)
Editorial Committee
Christophe Garenc, Direction des risques biologiques et de la santé au travail, Institut national de santé publique du Québec
Danielle Moisan, Centre hospitalier régional du Grand-Portage
Muleka Ngenda-Muadi, Direction des risques biologiques et de la santé au travail, Institut national de santé publique du Québec
Isabelle Rocher, Direction des risques biologiques et de la santé au travail, Institut national de santé publique du Québec
Mélissa Trudeau, Direction des risques biologiques et de la santé au travail, Institut national de santé publique du Québec
Jasmin Villeneuve, Direction des risques biologiques et de la santé au travail, Institut national de santé publique du Québec